Basic line chart with ggplot2 and geom_line()
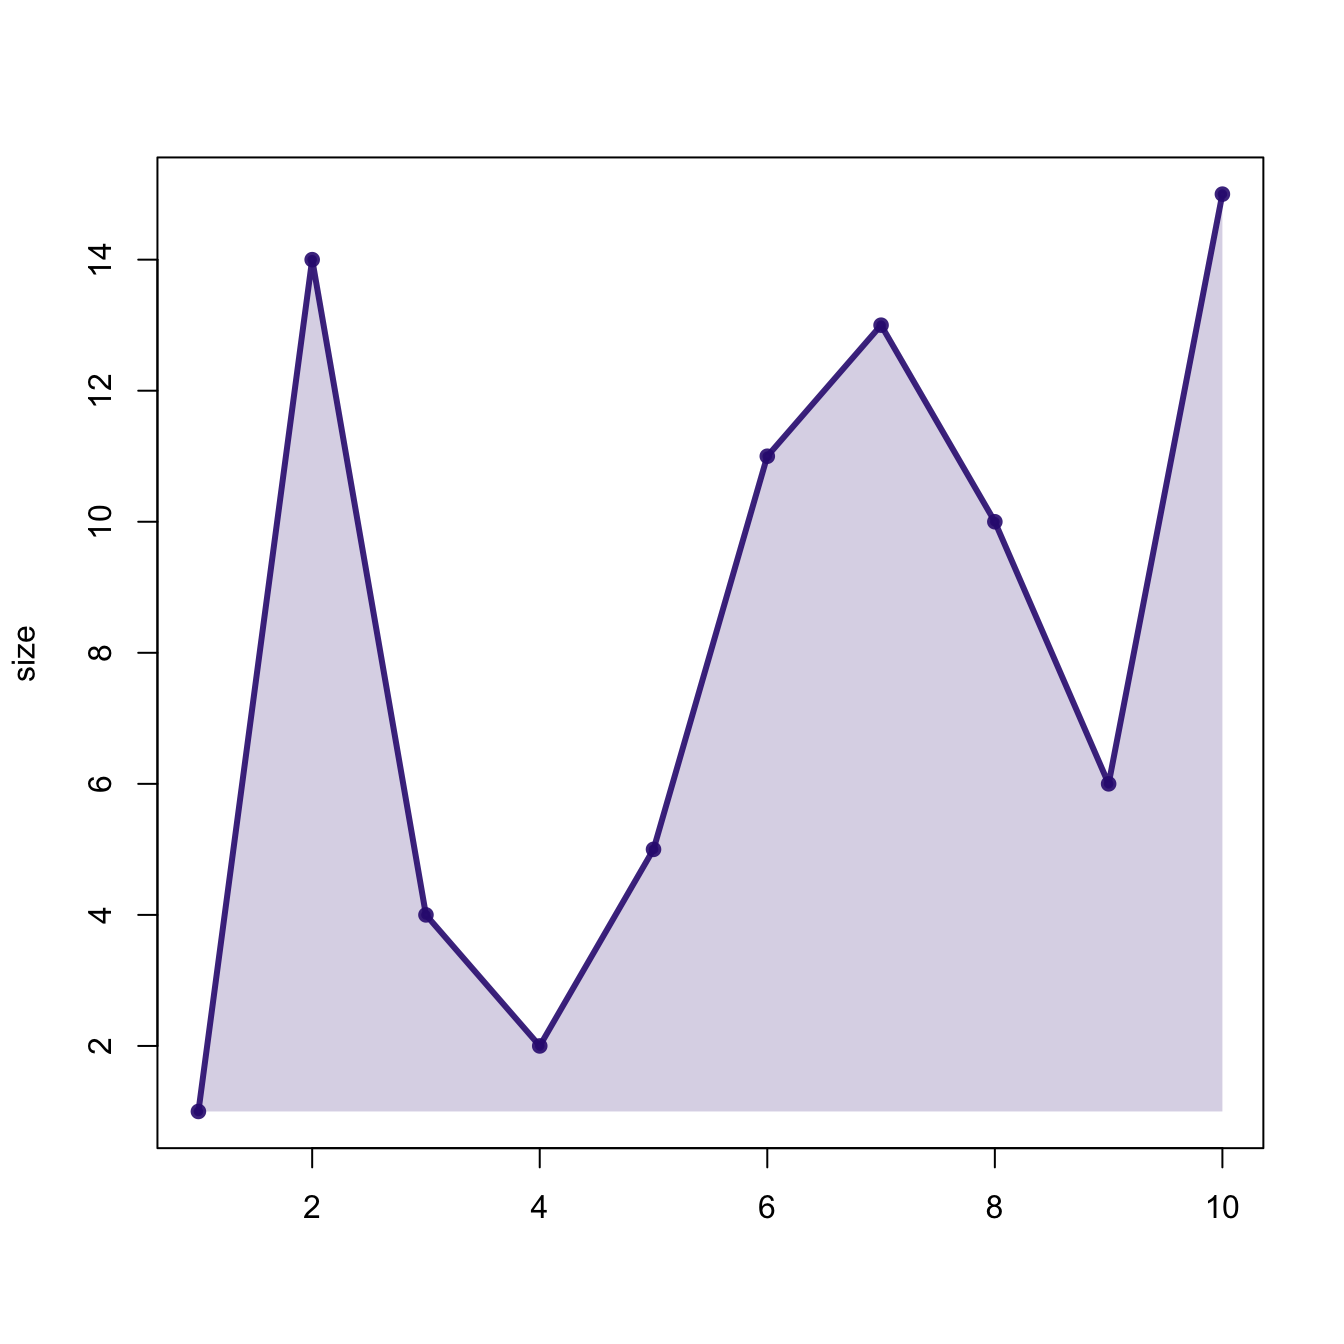
Base R also allows to build area charts thanks to the polygon() function. This functions requires 2 inputs: x and y.
Note that extreme values of both are added at the beginning and at the end of each vectors to make sure the polygon is closed.
# Create data
data <- data.frame(
  x=seq(1,10),
  y=sample(seq(1,15),10)
)

# Add line on top
plot( data$x , data$y , col=rgb(0.2,0.1,0.5,0.9) , type="o" , lwd=3 , xlab="" , ylab="size" , pch=20)

# Fill the area
polygon(
  c(min(data$x), data$x , max(data$x)) ,
  c( min(data$y) , data$y , min(data$y)) ,
  col=rgb(0.2,0.1,0.5,0.2) , border=F
)