Data visualization with base R

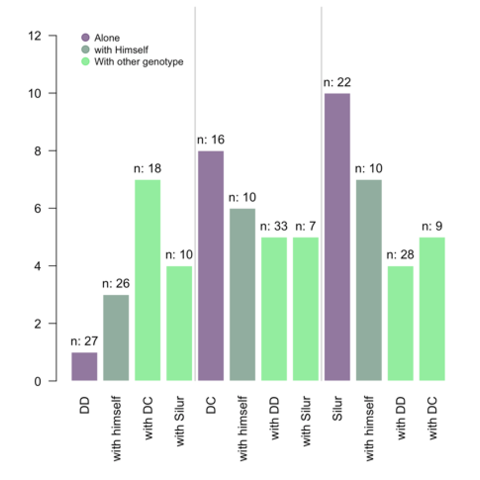
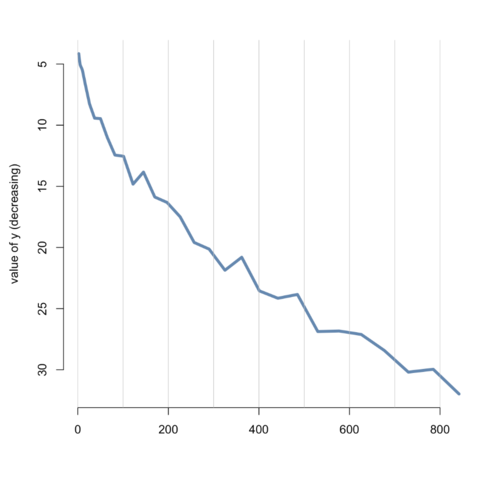
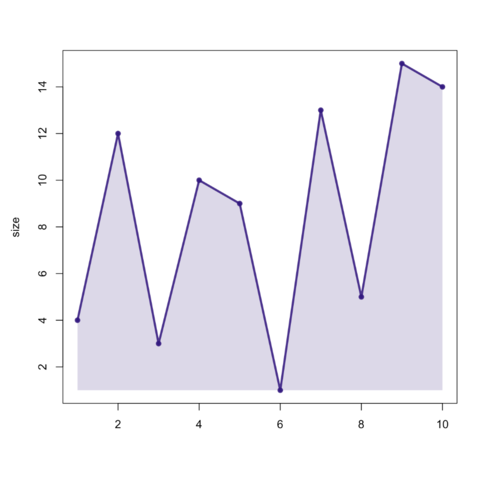
R did not wait for ggplot2 to offer awesome data visualization features.
It allows to build absolutely any type of chart, as described in this section and in the gallery.However, it often requires additional quantity of code, but
This section is dedicated to tips and tricks applying to any
base R chart. If you're interested in a specific chart type, browse the gallery as all
chart section offer base R option.
