Reordering groups in a ggplot2 chart can be a struggle. This is due to the fact that ggplot2 takes into account the order of the factor levels, not the order you observe in your data frame. You can sort your input data frame with sort() or arrange(), it will never have any impact on your ggplot2 output.
This post explains how to reorder the level of your factor through several examples. Examples are based on 2 dummy datasets:
# Library
library(ggplot2)
library(dplyr)
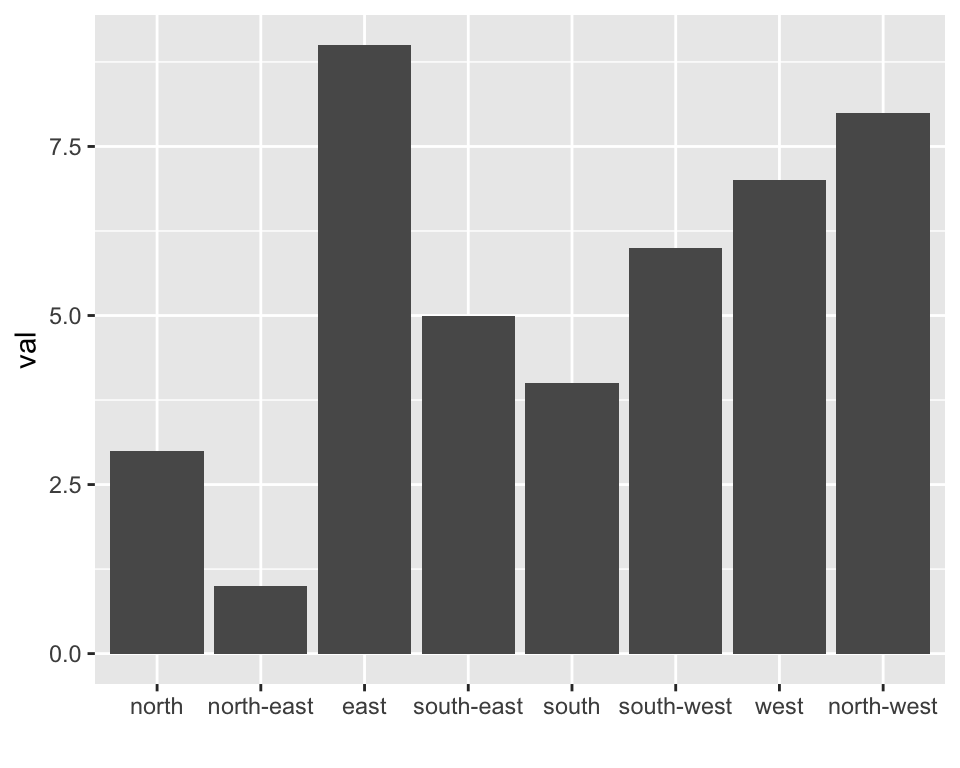
# Dataset 1: one value per group
data <- data.frame(
name=c("north","south","south-east","north-west","south-west","north-east","west","east"),
val=sample(seq(1,10), 8 )
)
# Dataset 2: several values per group (natively provided in R)
# mpgMethod 1: the Forecats library
The Forecats library is a library from the tidyverse especially made to handle factors in R. It provides a suite of useful tools that solve common problems with factors. The fact_reorder() function allows to reorder the factor (data$name for example) following the value of another column (data$val here).
# load the library
library(forcats)
# Reorder following the value of another column:
data %>%
mutate(name = fct_reorder(name, val)) %>%
ggplot( aes(x=name, y=val)) +
geom_bar(stat="identity", fill="#f68060", alpha=.6, width=.4) +
coord_flip() +
xlab("") +
theme_bw()
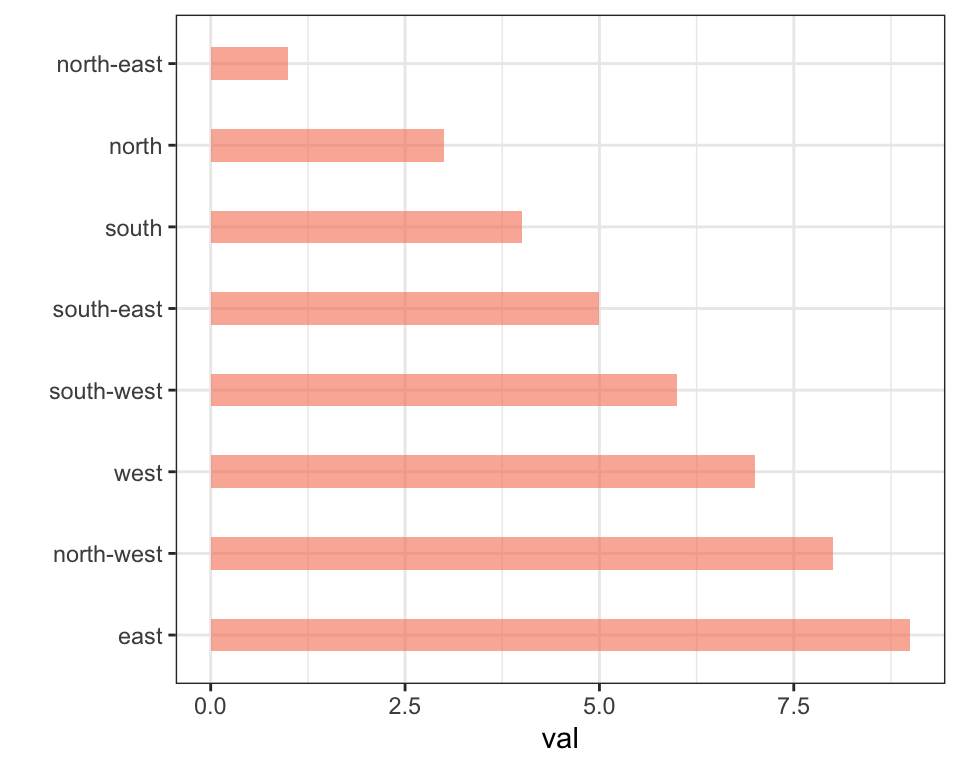
# Reverse side
data %>%
mutate(name = fct_reorder(name, desc(val))) %>%
ggplot( aes(x=name, y=val)) +
geom_bar(stat="identity", fill="#f68060", alpha=.6, width=.4) +
coord_flip() +
xlab("") +
theme_bw()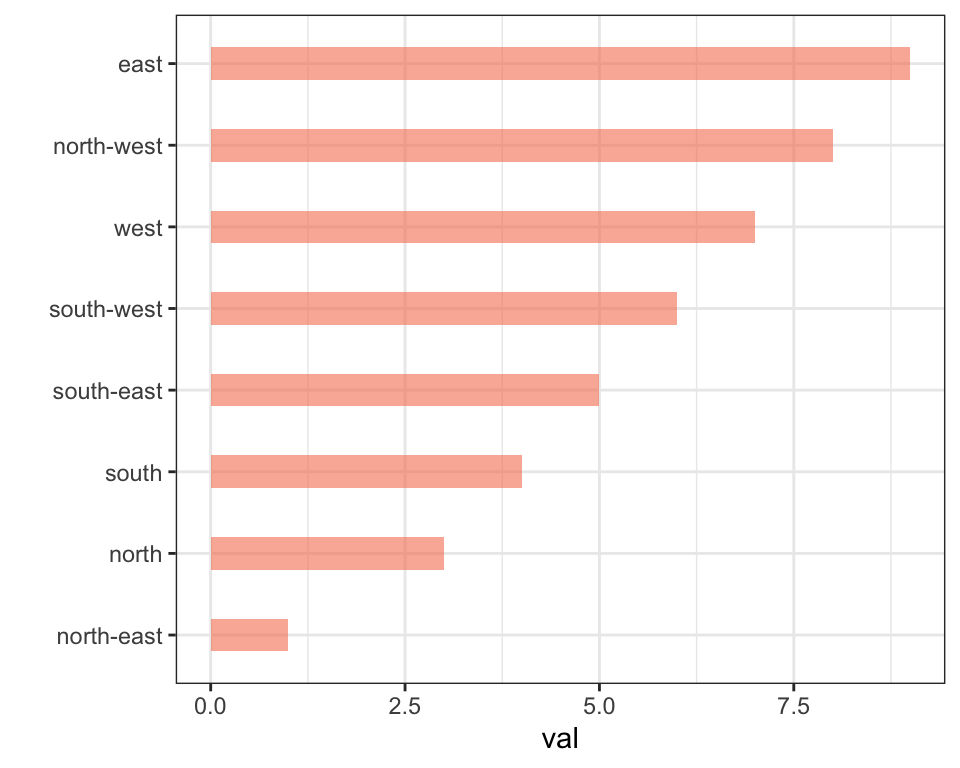
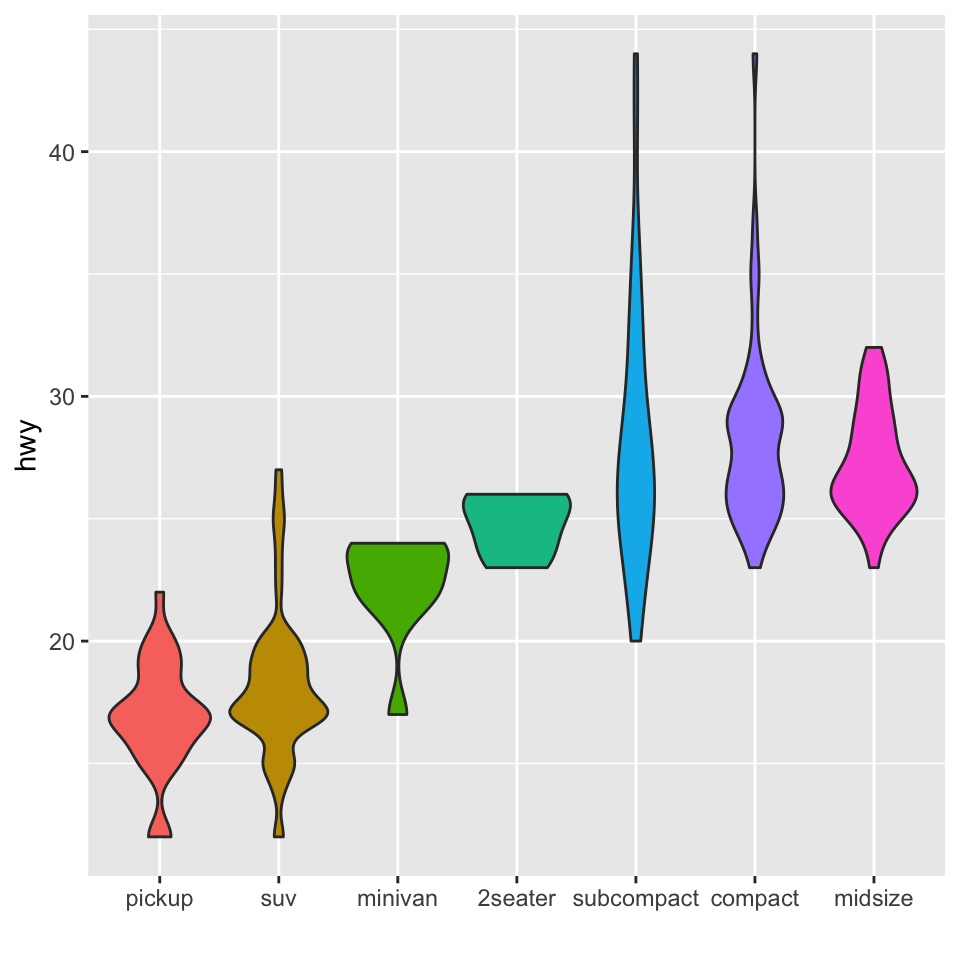
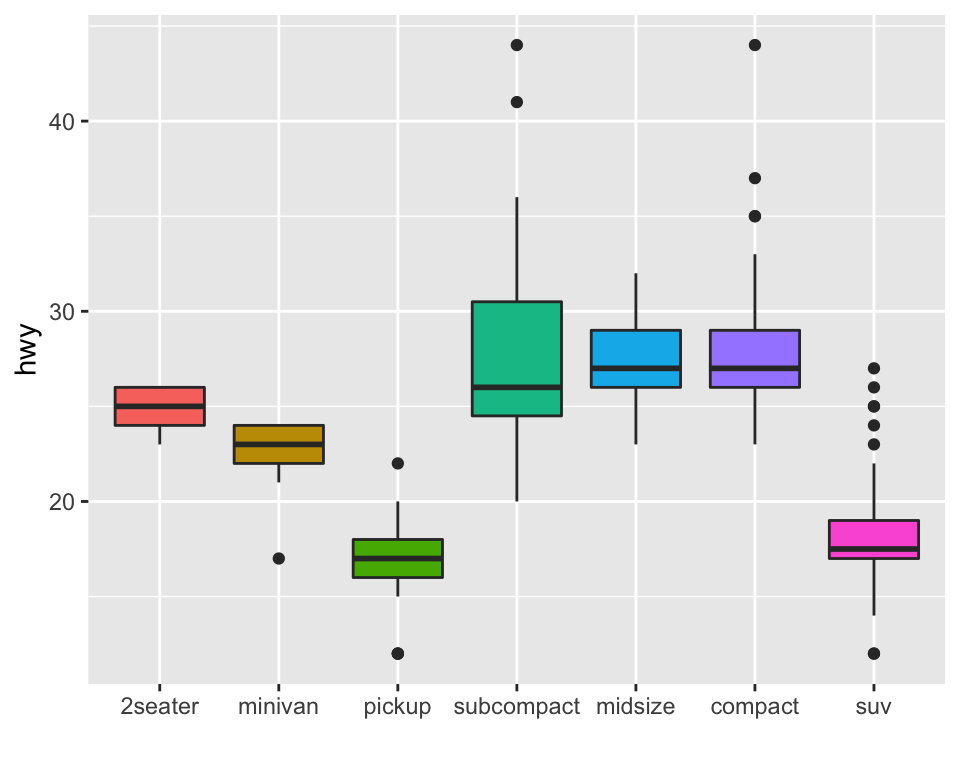
If you have several values per level of your factor, you can specify which function to apply to determine the order. The default is to use the median, but you can use the number of data points per group to make the classification:
# Using median
mpg %>%
  mutate(class = fct_reorder(class, hwy, .fun='median')) %>%
  ggplot( aes(x=reorder(class, hwy), y=hwy, fill=class)) +
    geom_boxplot() +
    xlab("class") +
    theme(legend.position="none") +
    xlab("")

# Using number of observation per group
mpg %>%
  mutate(class = fct_reorder(class, hwy, .fun='length' )) %>%
  ggplot( aes(x=class, y=hwy, fill=class)) +
    geom_boxplot() +
    xlab("class") +
    theme(legend.position="none") +
    xlab("") +
    xlab("")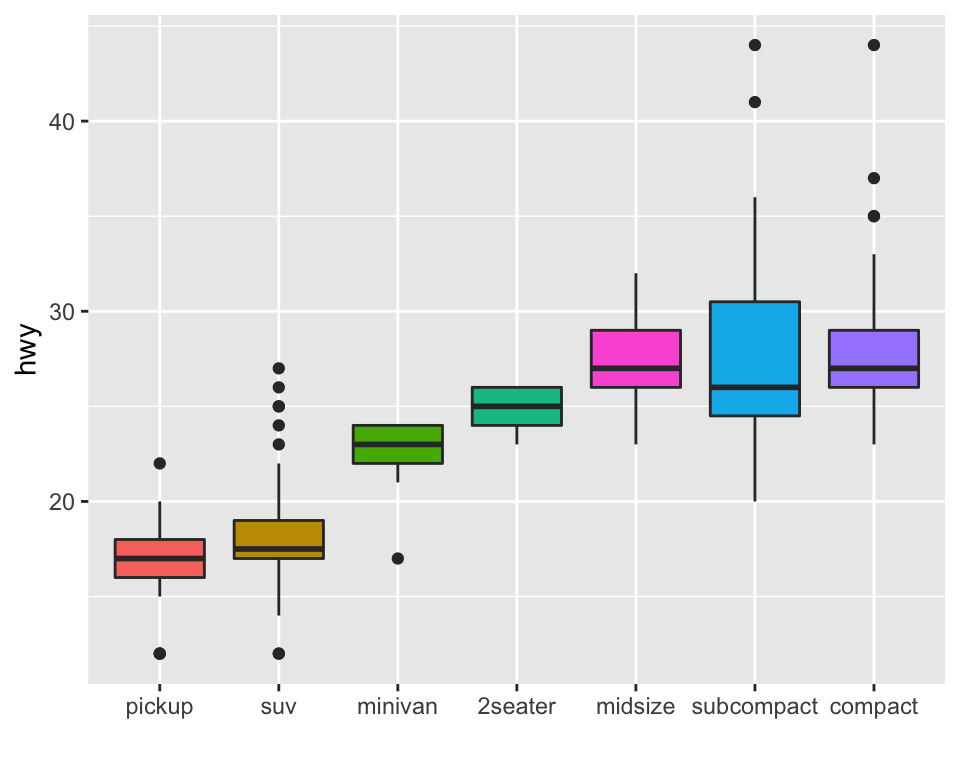
The last common operation is to provide a specific order to your levels, you can do so using the fct_relevel() function as follow:
Method 2: using dplyr only
The mutate() function of dplyr allows to create a new variable or modify an existing one. It is possible to use it to recreate a factor with a specific order. Here are 2 examples:
- The first use
arrange()to sort your data frame, and reorder the factor following this desired order.
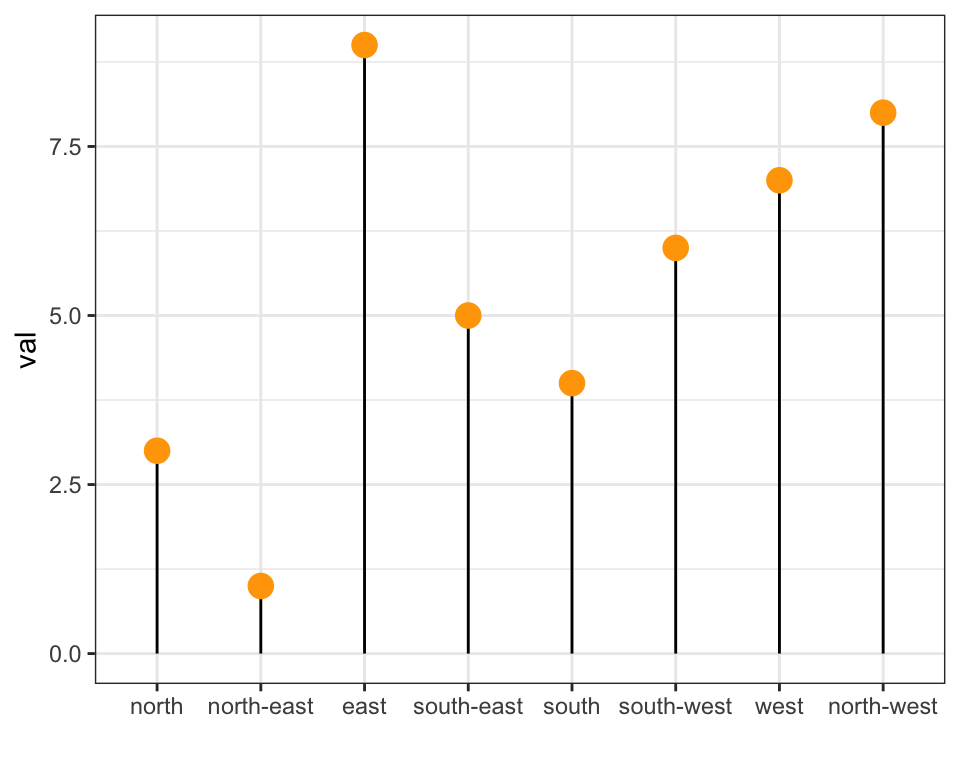
- The second specifies a custom order for the factor giving the levels one by one.
data %>%
  arrange(val) %>%    # First sort by val. This sort the dataframe but NOT the factor levels
  mutate(name=factor(name, levels=name)) %>%   # This trick update the factor levels
  ggplot( aes(x=name, y=val)) +
    geom_segment( aes(xend=name, yend=0)) +
    geom_point( size=4, color="orange") +
    coord_flip() +
    theme_bw() +
    xlab("")

data %>%
  arrange(val) %>%
  mutate(name = factor(name, levels=c("north", "north-east", "east", "south-east", "south", "south-west", "west", "north-west"))) %>%
  ggplot( aes(x=name, y=val)) +
    geom_segment( aes(xend=name, yend=0)) +
    geom_point( size=4, color="orange") +
    theme_bw() +
    xlab("")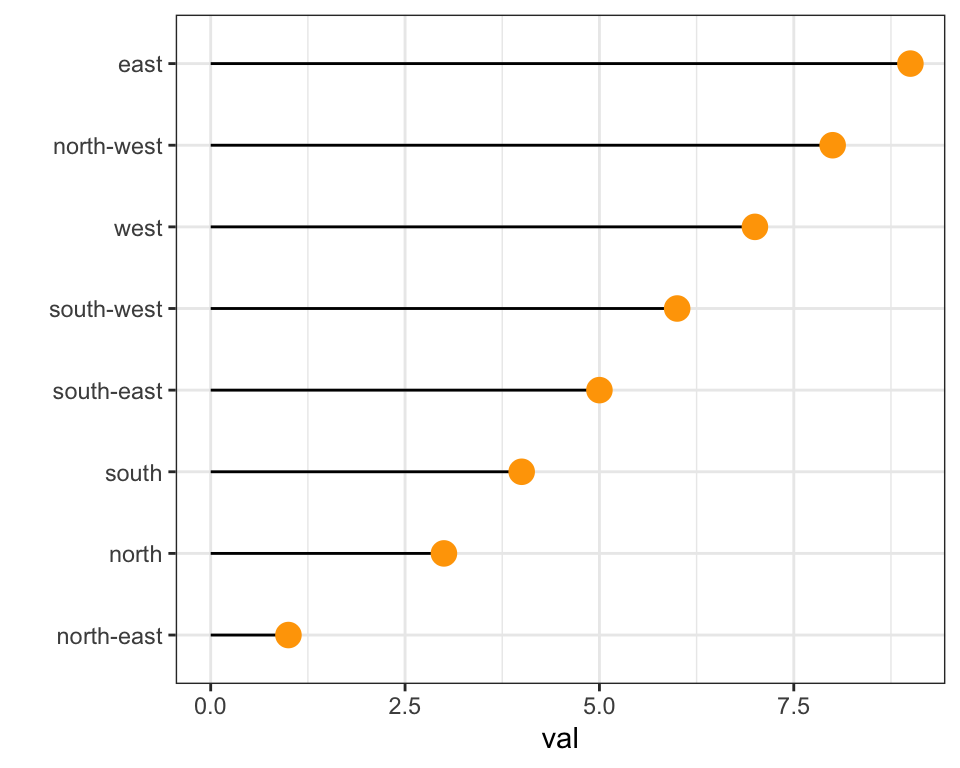
Method 3: the reorder() function of base R
In case your an unconditional user of the good old R, here is how to control the order using the reorder() function inside a with() call: