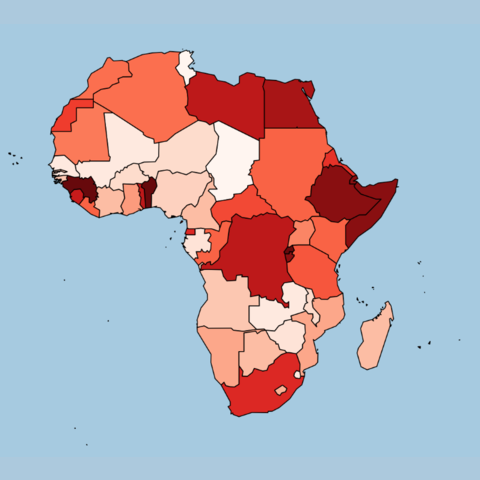
Choropleth map with
ggplot2ggplot2 is my favourite way to make a static choropleth map. In this post I show how to load geoJSON geographical data, link it with a numeric variable and plot it as a choropleth. Another advantage of this method is that it allows to quickly transform your map in an interactive version with plotly (see further).
Choropleth map in
base RNo specific library is needed to build a choropleth map once the geospatial object is loaded in R. The examples below explain how to build a color palette and attribute a color to each region, according to its numeric value.
Interactive choropleth map with
leafletThe leaflet package allows to build interactive map directly from R. On the following choropleth map it is possible to zoom and hover a country to gets more details about it. Read the tutorial.
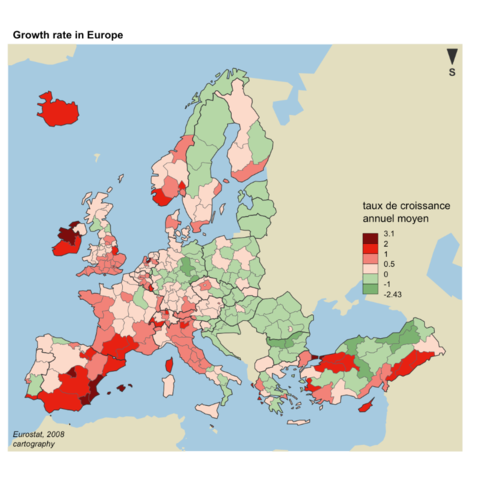
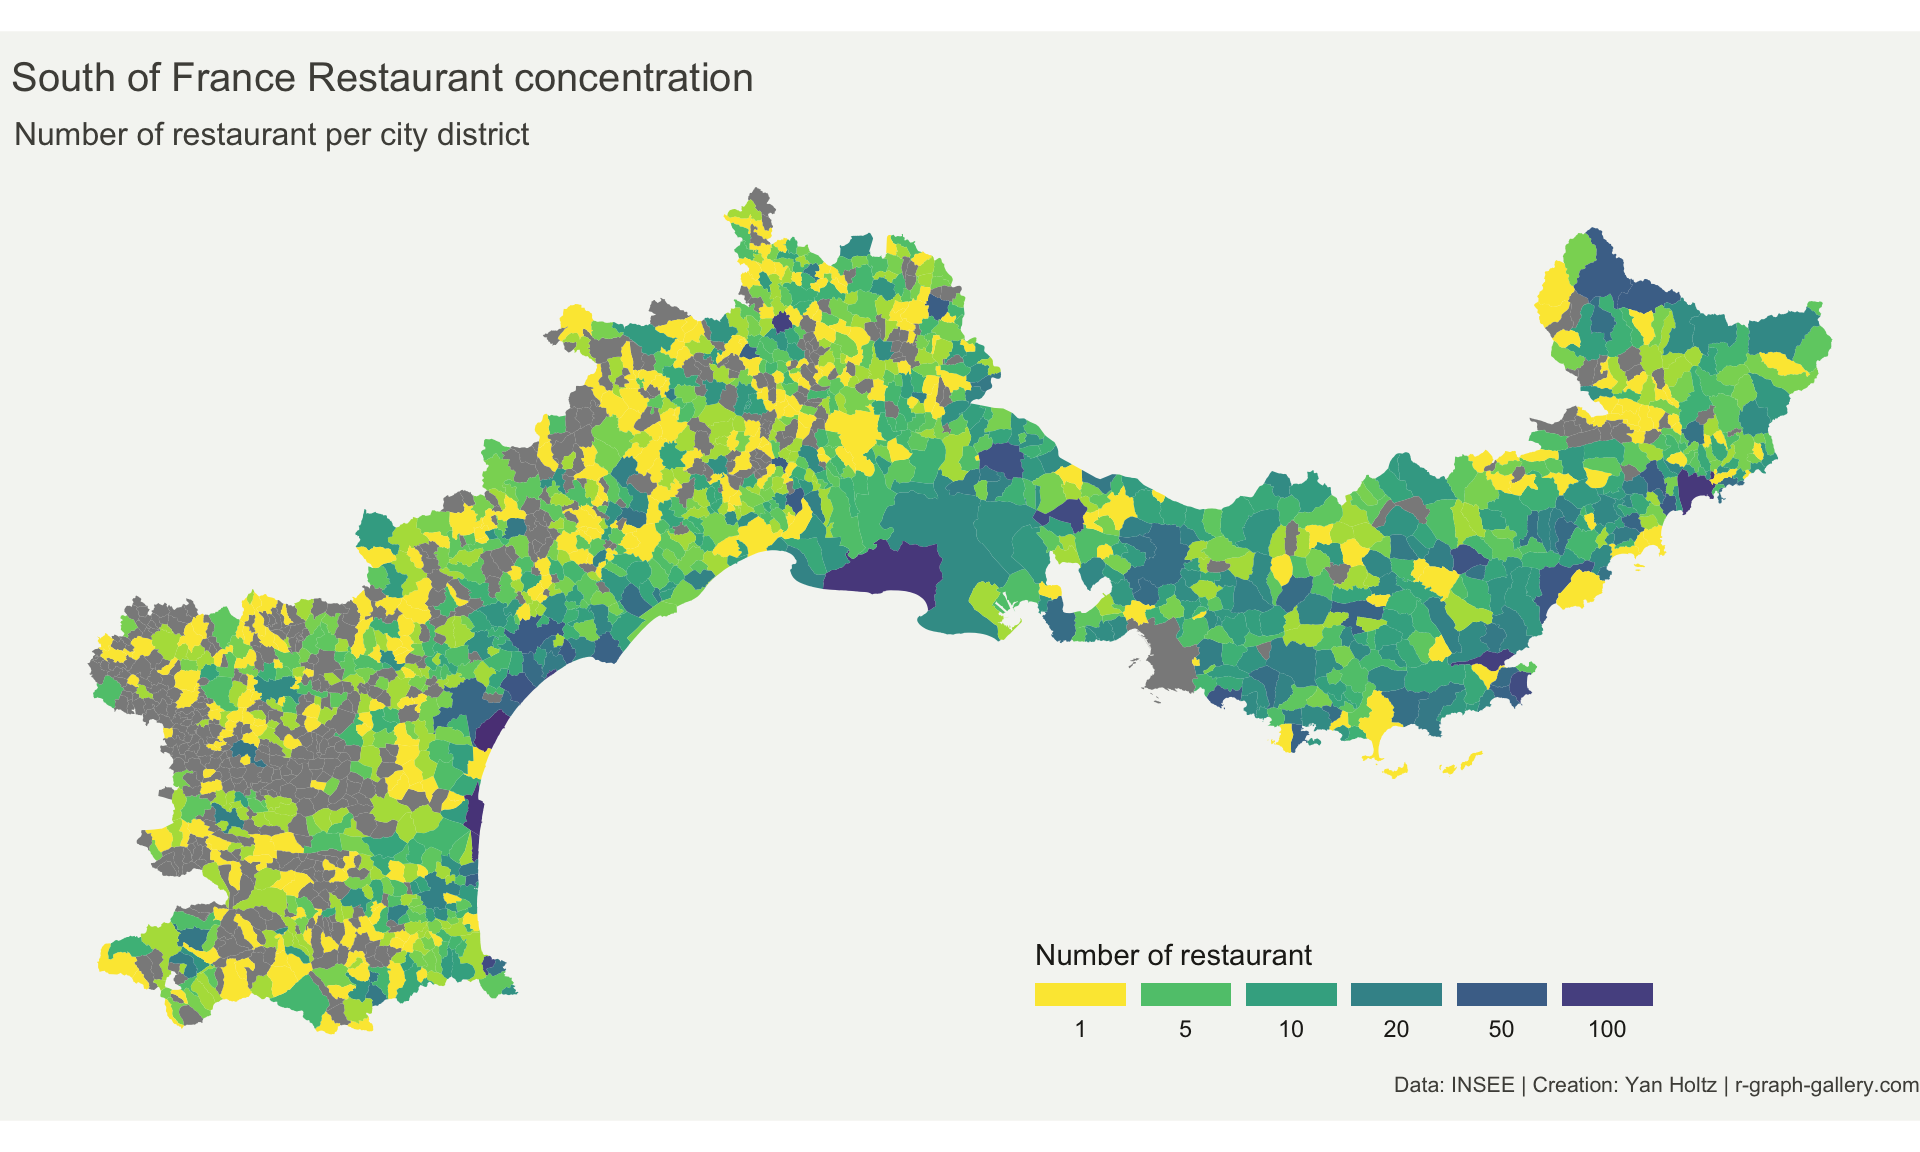
Choropleth map with the
cartography package.