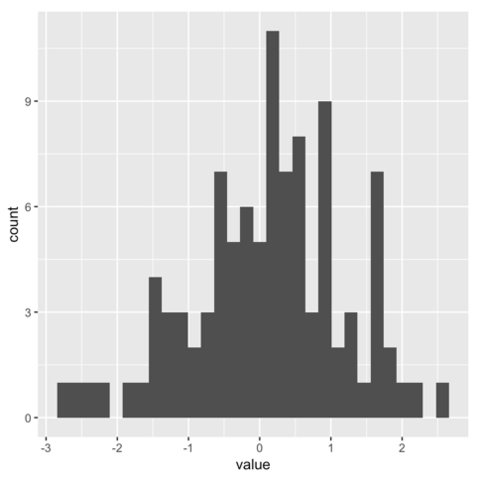
Ggplot2
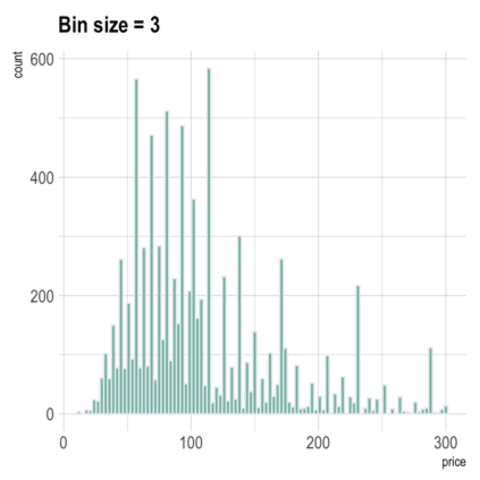
Histograms can be built with ggplot2 thanks to the geom_histogram() function. It requires only 1 numeric variable as input. This function automatically cut the variable in bins and count the number of data point per bin. Remember to try different bin size using the binwidth argument.
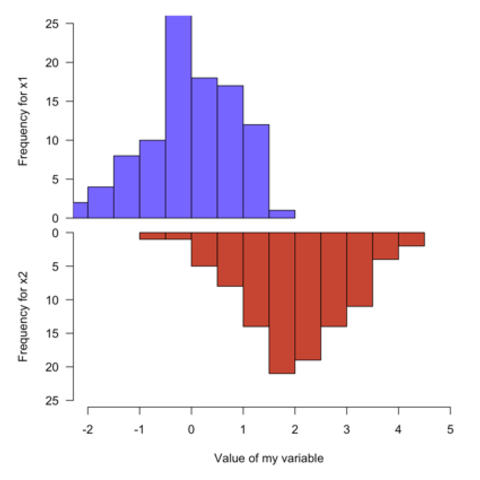
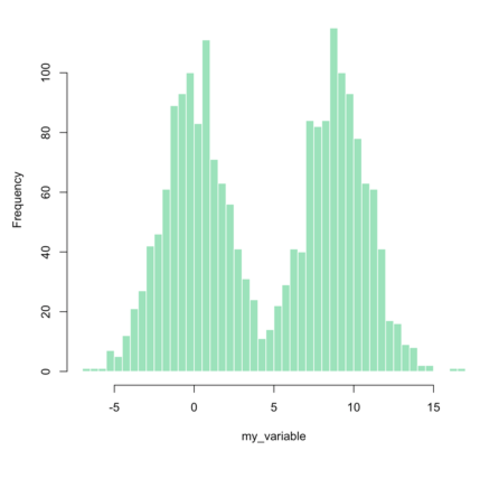
Base R
Of course it is possible to build high quality histograms without ggplot2 or the tidyverse. Here are a few examples illustrating how to proceed.