基于ggplot2包以及corrplot包的相关矩阵可视化包ggcorrplot,ggcorrplot包提供对相关矩阵重排序以及在相关图中展示显著性水平的方法,同时也能计算相关性p-value
安装方法不懂的可以浏览我以前的文章(可戳链接)
# 国内清华镜像快速安装包
site=”https://mirrors.tuna.tsinghua.edu.cn/CRAN”
install.packages(“ggcorrplot”, repo=site)
library(ggcorrplot)
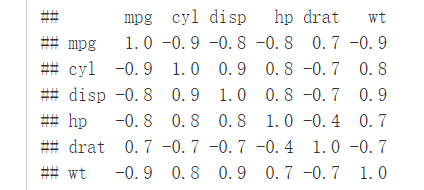
#计算相关矩阵(cor()计算结果不提供p-value)
data(“mtcars”)
corr <- round(cor(mtcars), 1)
head(corr[, 1:6])
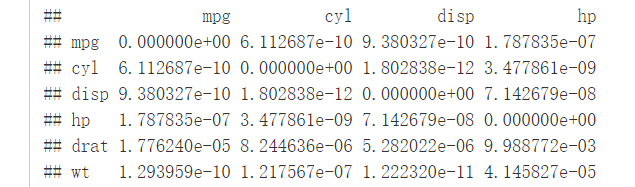
#用ggcorrplot包提供的函数cor_pmat()
p.mat <- cor_pmat(mtcars)
head(p.mat[, 1:4])
可视化相关性矩阵
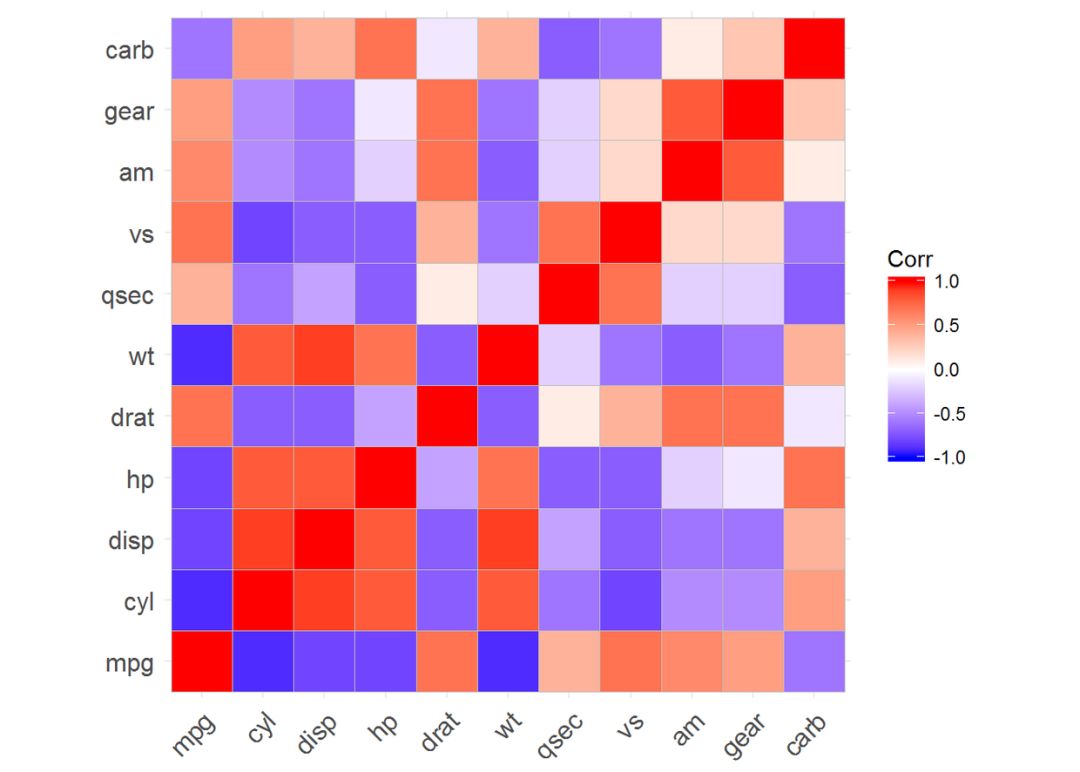
ggcorrplot(corr)#method默认为square
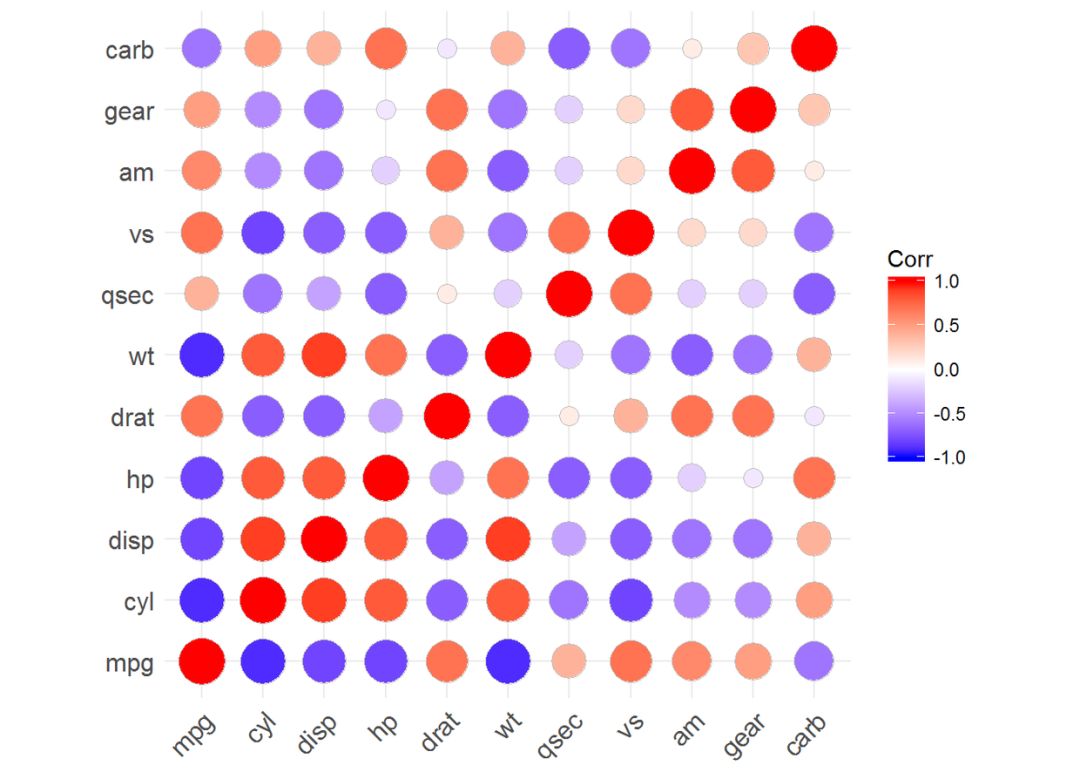
#方法为circle
ggcorrplot(corr, method = “circle”)
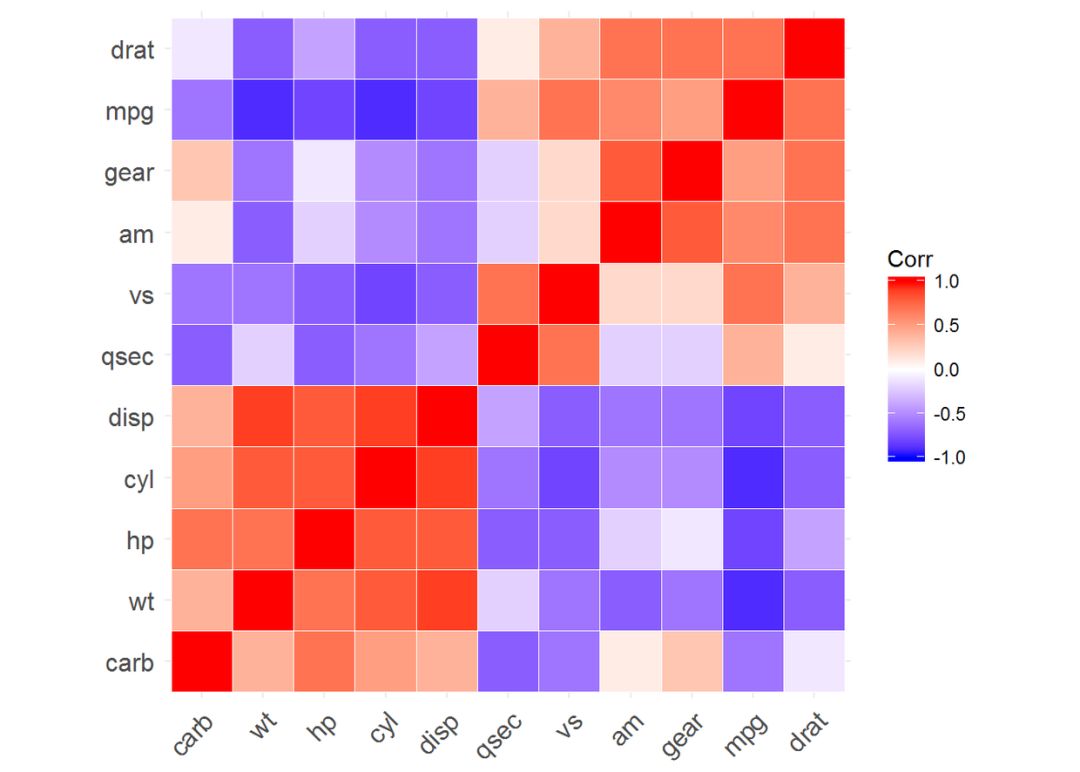
#重排矩阵,使用分等级聚类
ggcorrplot(corr, hc.order = TRUE, outline.color = “white”)
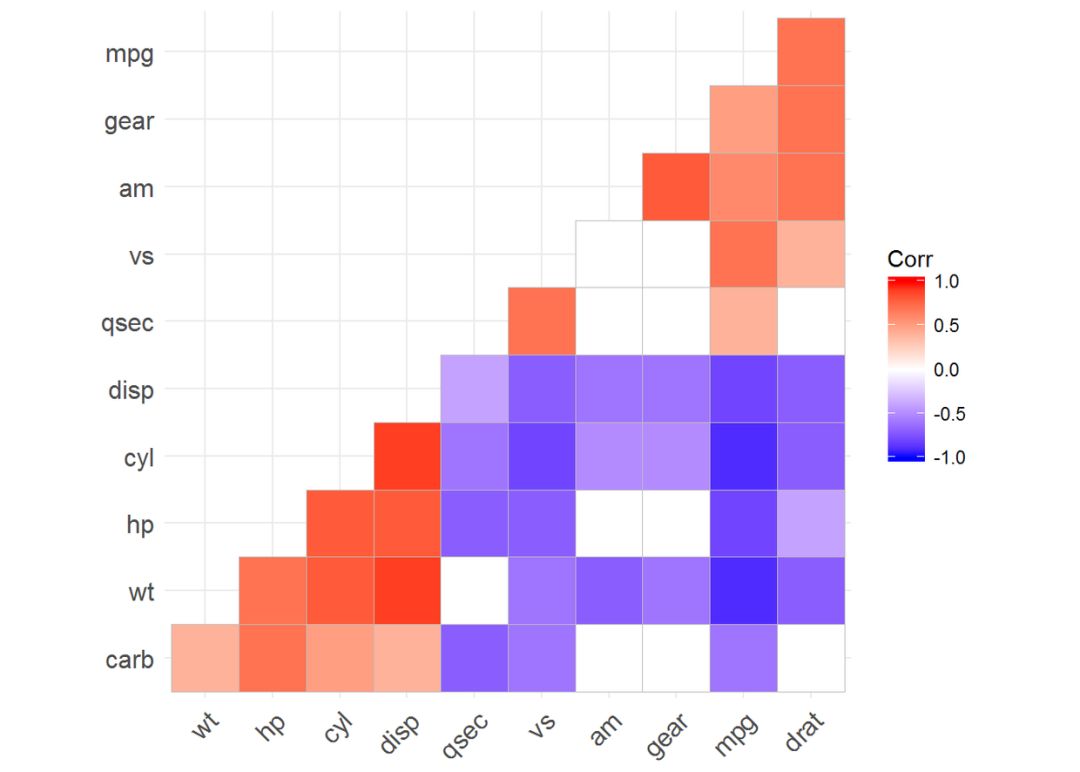
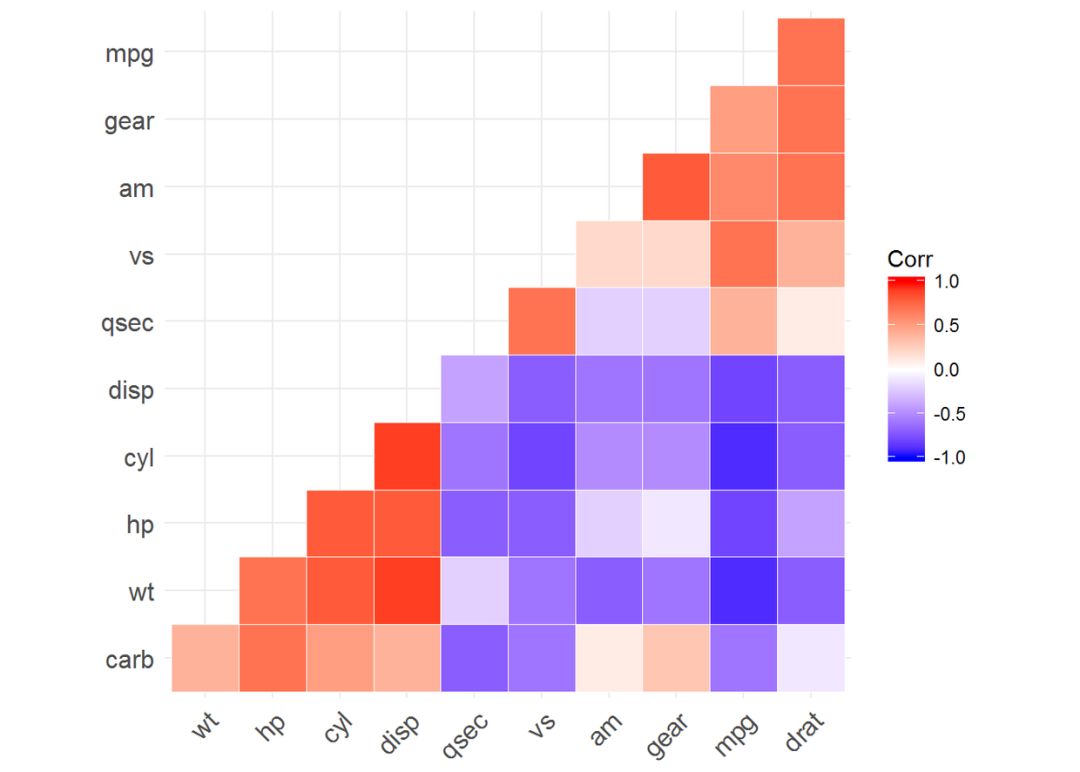
#控制矩阵形状
ggcorrplot(corr, hc.order = TRUE, type = “lower”, outline.color = “white”)#下三角形
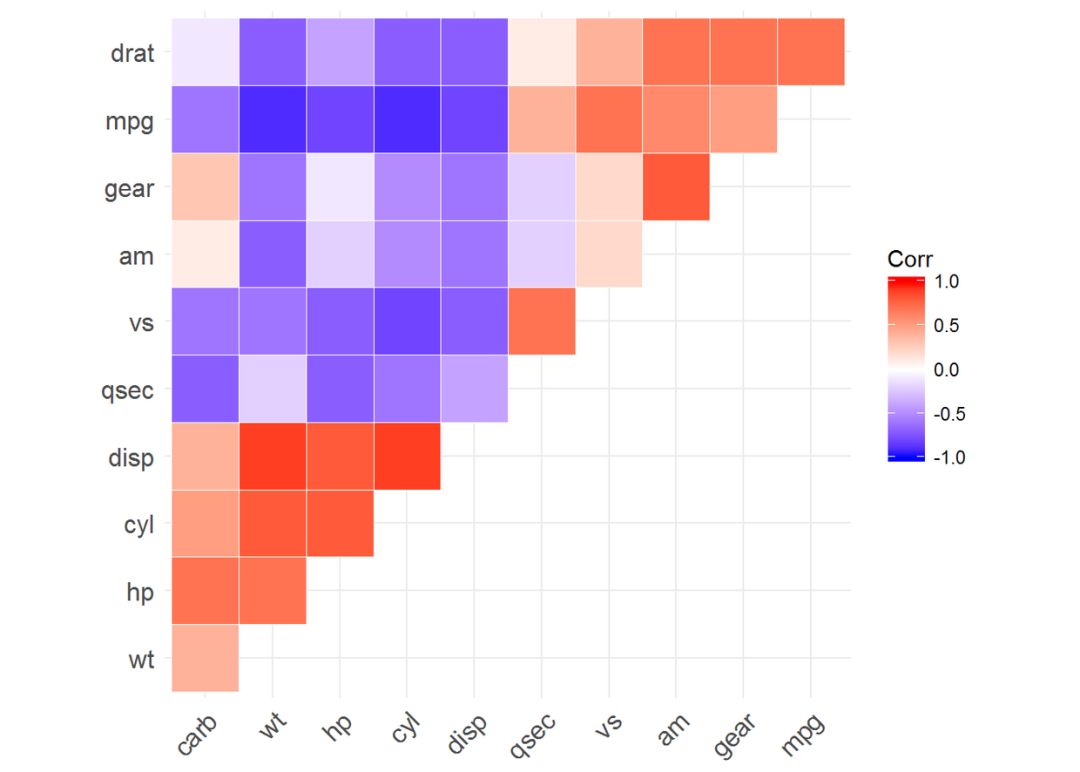
#上三角形
ggcorrplot(corr, hc.order = TRUE, type = “upper”, outline.color = “white”)
#更改颜色以及主题
ggcorrplot(corr, hc.order = TRUE, type = “lower”, outline.color = “white”,
ggtheme = ggplot2::theme_gray, colors = c(“#6D9EC1”, “white”, “#E46726”))

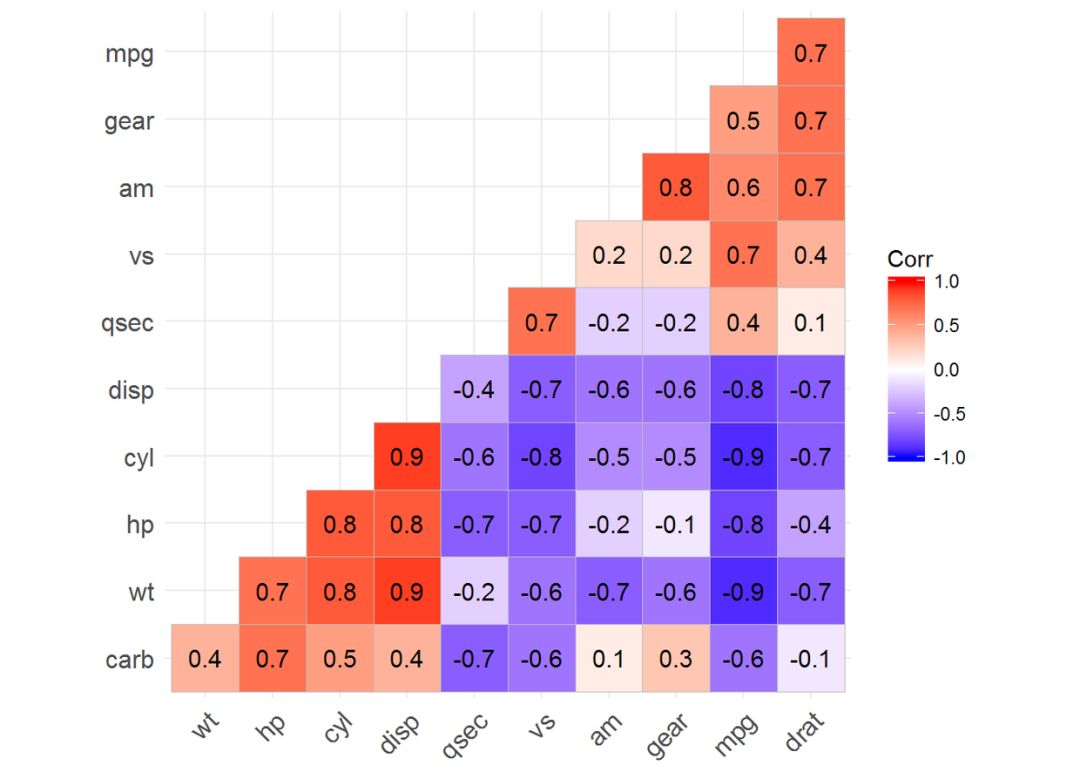
#添加相关系数
ggcorrplot(corr, hc.order = TRUE, type = “lower”, lab = TRUE)
#增加显著性水平,不显著的话就不添加了
ggcorrplot(corr, hc.order = TRUE, type = “lower”, p.mat = p.mat)
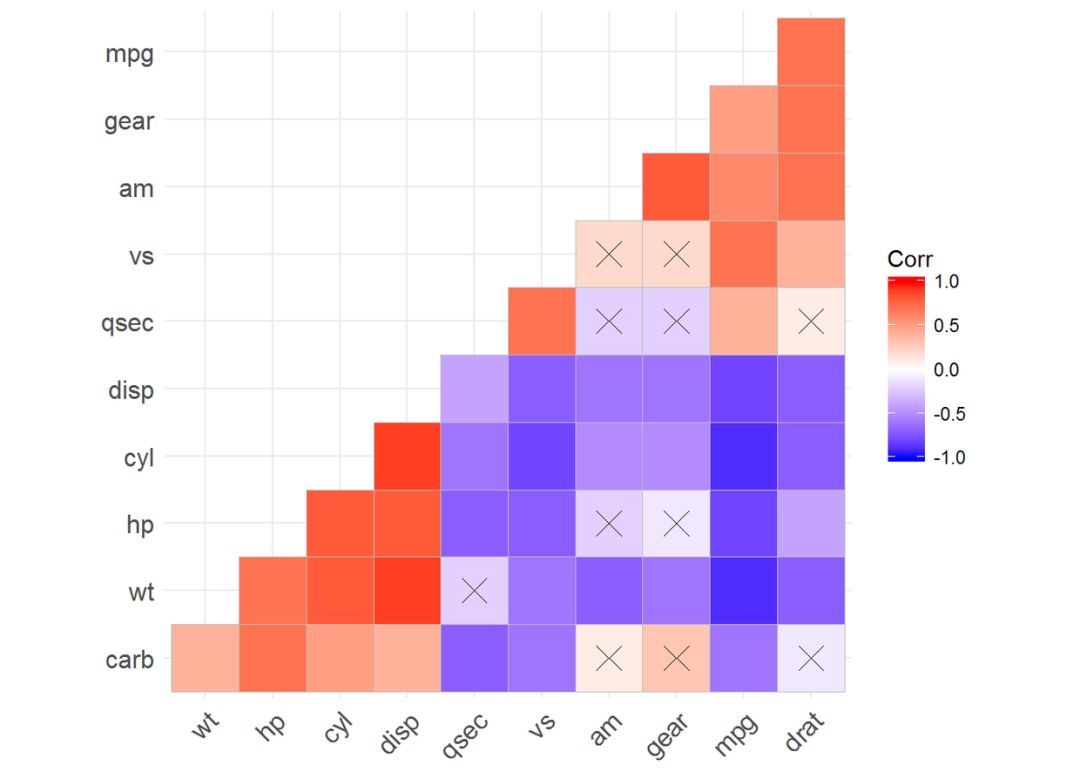
#将不显著的色块设置成空白
ggcorrplot(corr, p.mat = p.mat, hc.order=TRUE, type = “lower”, insig = “blank”)