目的:
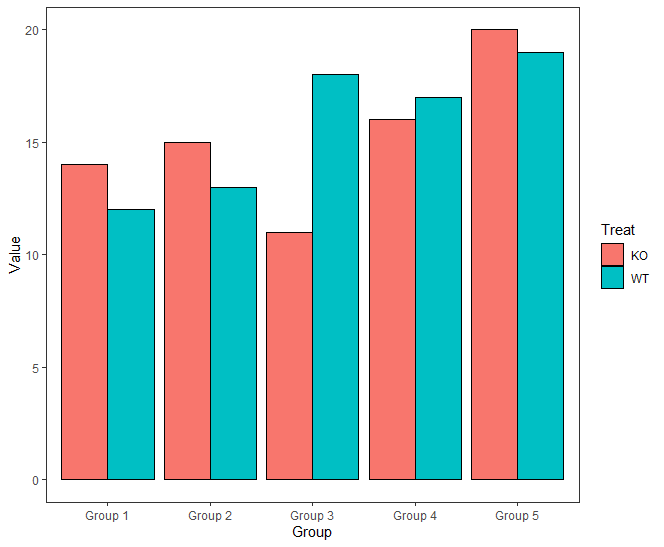
分组柱状图,可以用ggplot2很快的实现,这边换一种更为灵活的呈现方式以满足不同需求
  data0 = data.frame( "Group"=paste(rep("Group",10),rep(1:5,c(2,2,2,2,2))),"Treat"=rep(c("WT","KO"),5),"Value" = sample(11:20))
ggplot(data0) +
  geom_bar(aes(Group, Value, fill =Treat), color = "black", stat = "identity",position=position_dodge(0.75)) +
  theme_bw()+
  theme(panel.grid.major =element_blank(), panel.grid.minor = element_blank())
Demo 1:
library(ggplot2)
data = data.frame("Sample" = 1:10 + rep(c(0.1, -0.1), 5), "Value" = sample(11:20),"Group"=paste(rep("Group",10),rep(1:5,c(2,2,2,2,2))))
ggplot(data) +
geom_bar(aes(Sample, Value, fill =Group), color = "black", stat = "identity") +
scale_x_continuous(breaks = 1:10 + rep(c(0.1, -0.1), 5),
labels = LETTERS[1:10]) +
theme_bw()+
theme(panel.grid.major =element_blank(), panel.grid.minor = element_blank())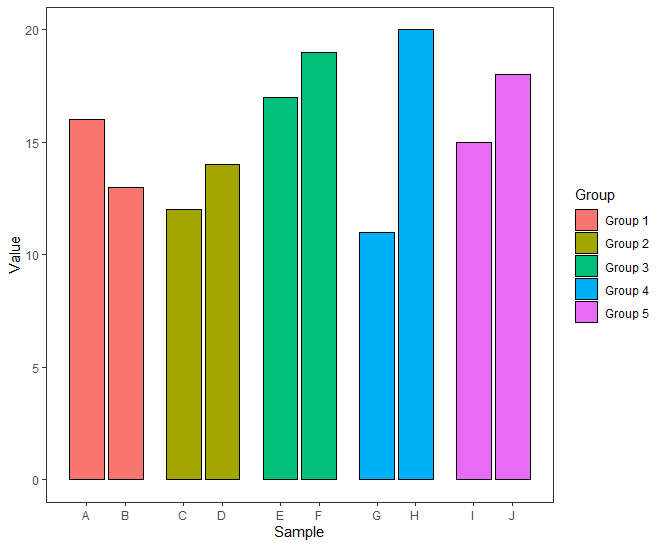
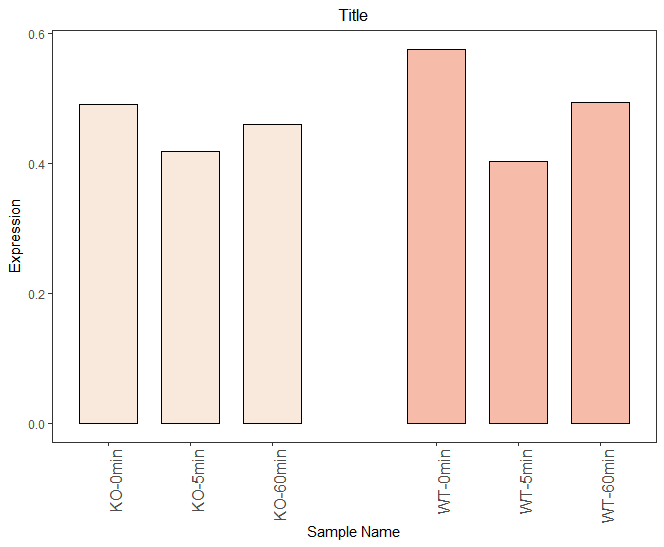
Demo 2:
data2<-data.frame("group"=rep(c("KO","WT"),3),"time"=c("0min","0min","5min","5min","60min","60min"),
"Mean"= runif(6, min=0.4, max=0.6),
"Sd"=runif(6, min=0, max=0.1))
data2<-data2[order(data2$group),]
data2$group_id<-c(1,2,3,5,6,7)
mycol= c("#F9E8DC","#F6BBA9")
ggplot(data2)+
  aes(x=group_id, y=Mean,fill=group)+
  geom_col(width=.7,position=position_dodge(0.3))+
  geom_bar(stat="identity", position=position_dodge(0.6),color="black", width=.7) +
  labs(x="Sample Name", y=expression('Expression'),title = "Title")+
  scale_fill_manual(values = mycol)+
  scale_x_continuous(breaks = c(1,2,3,5,6,7) ,labels = paste(data2$group,data2$time,sep = "-"))+
  geom_errorbar(aes(ymin=Mean-Sd, ymax=Mean +Sd),position=position_dodge(.6), width=.2) +
  theme_bw()+ theme(legend.position = c(1.1, 0.7),legend.direction = "vertical", # c(0.13, 0.80)
                    legend.text = element_text(size = 11),
                    panel.grid.major =element_blank(), panel.grid.minor = element_blank(),
                    axis.text.x = element_text(size = 12,hjust = 1, vjust = 1, angle = 90),plot.title = element_text(hjust = 0.5))