Measurement of Transgene Copy Number in Plants Using Droplet Digital PCR —BIO-PROTOCOL
Abstract
Transgenic plants are produced both to investigate gene function and to confer desirable traits into crops. Transgene copy number is known to influence expression levels, and consequently, phenotypes. Similarly, knowledge of transgene zygosity is desirable for making quantitative assessments of phenotype and tracking the inheritance of transgenes in progeny generations. Since the first transgenic plants were produced, several methods for determining copy number have been applied, including Southern blotting, quantitative real-time PCR, and more recently, sequencing methods; however, each method has specific disadvantages, compromising throughput, accuracy, or expense. Digital PCR (dPCR) divides reactions into partitions, converting the exponential, analogue nature of PCR into a linear, digital signal that allows the frequency of occurrence of specific sequences to be accurately estimated. Confidence increases with the number of partitions; therefore, the availability of emulsion technologies that enable reactions to be divided into tens of thousands of nanodroplets allows accurate determination of copy number in what has become known as digital droplet PCR (ddPCR). ddPCR offers similar benefits of low costs and scalability as other PCR techniques but with superior accuracy and reliability.
Graphic abstract:
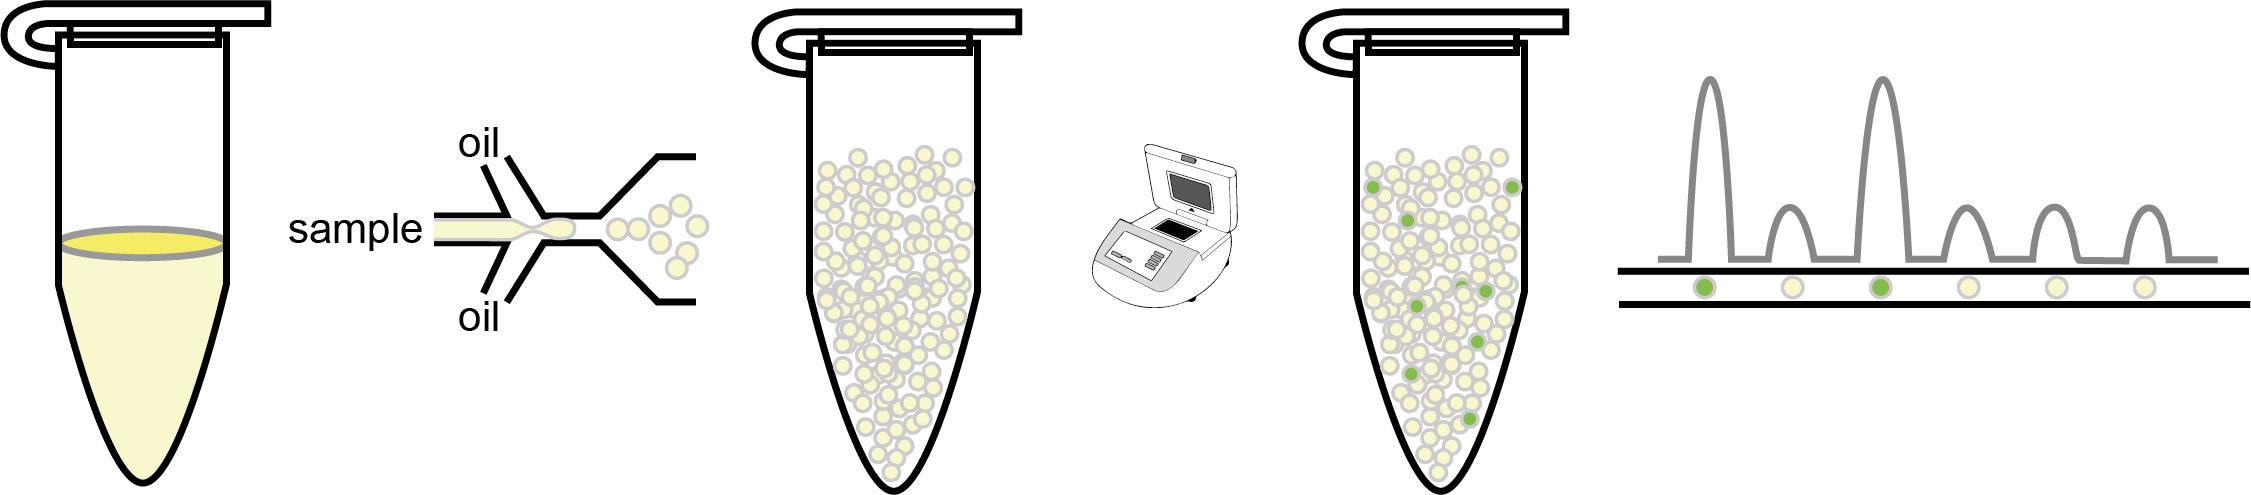
Digital PCR (dPCR) divides reactions into partitions, converting the exponential, analogue nature of PCR into a linear, digital signal that allows the frequency of transgene copy number to be accurately assessed.
Keywords: Digital PCR (数字PCR), Digital droplet PCR (微滴式数字PCR), Transgene copy number (转基因拷贝数), Plants (植物), T-DNA (转移DNA)
Background
Plant transformation is used as a research tool to investigate gene function as well as for the production of genetically engineered crops. Several methods are used to deliver DNA into plant cells, including direct delivery into isolated protoplasts, biolistic delivery using high-density microparticles, Agrobacterium tumefaciens-mediated delivery, and most recently, nanoparticles (Altpeter et al., 2016; Wang et al., 2019). DNA delivery techniques can be optimized to obtain a higher frequency of transgenic lines with single or low-copy insertions; however, the exact number of transgenes transferred to the plant genome cannot be controlled or limited, and transgenic lines must be individually assessed to determine transgene copy number (Sivamani et al., 2015). Since expression levels, and consequently phenotypes, have long been acknowledged to be influenced by copy number, accurate determination is essential (Hobbs et al., 1993). Copy number determination can also be used to track inheritance and zygosity. Most methods of plant transformation deliver transgenes to somatic cells from which transgenic plants (referred to as T0) are regenerated, each with one more hemizygous transgenic locus. In progeny resulting from self-fertilization, transgenic loci usually follow classical Mendelian inheritance; although, non-Mendelian segregation has also been reported (Ahuja and Fladung, 2014). Accurate determination of copy number can be used to track transgenes through progeny generations, being particularly useful in lines with multiple transgene copies and in obligate outcrossing species.
In the decades since plant transformation became routine, a number of different technologies have been used to determine copy number. Initially, copy number was determined by Southern hybridization analysis (Southern, 1975). In this technique, genomic DNA is digested with a restriction endonuclease, separated by electrophoresis, and following transfer to a membrane, fragments containing the transgene are detected using a labeled DNA probe. As well as being laborious, it can be challenging to detect transgenes inserted close together (in tandem repeats), which are likely to be on the same fragment. Further, unless there is sufficient heterozygosity so that homologous chromosomes have different fragmentation patterns after restriction digestion, detection of zygosity is reliant on differences in band intensity, which is considered unreliable (Cantsilieris et al., 2013).
In the first decades of the twenty-first century, quantitative real-time PCR (qPCR) became the method of choice for estimating plant transgene copy number (Bubner and Baldwin, 2004; Li et al., 2004; Weng et al., 2004; Yang et al., 2005a and 2005b; Yi and Hong, 2019). The concentration of the transgene in each sample is compared with either a standard curve or a validated reference gene (an endogenous gene of known copy number) (Pfaffl, 2001). However, since each cycle of PCR is a doubling reaction, the two-fold increase required to differentiate one copy from two copies, or a hemizygote from a homozygote, is at the detection limit. Even with optimization, it can be challenging to achieve the levels of accuracy required to distinguish single copy and two-copy lines (Cantsilieris et al., 2013; Mieog et al., 2013).
Next-generation sequencing (NGS) technologies have reduced the cost of sequencing; however, even low-pass shallow sequencing, sometimes called ‘skim-sequencing,’ is expensive for large plant genomes – prohibitively so for routine copy number detection (Golicz et al., 2015; Kim et al., 2016). Targeted-capture sequencing, in which regions of the genome containing sequences of interest are isolated, has allowed the generation of accurate copy number data together with information on the sequence identity of insertion sites at reduced costs (Guttikonda et al., 2016). Initially, short-read next-generation sequencing technologies were applied (Polkoa et al., 2012; Lepage et al., 2013; Guo et al., 2016), but more recently, long-read nanopore-based sequencing platforms have also been utilized (Li et al., 2019; Boutigny et al., 2020). However, compared with PCR-based methods, even capture sequencing techniques have higher costs and require more time for sample preparation and data analysis.
Digital PCR (dPCR) converts the exponential, analogue nature of PCR into a linear, digital signal allowing accurate estimations of the frequency of occurrence of specific sequences (Vogelstein and Kinzler, 1999). To do this, each sample is divided into a large number of partitions, and PCR reactions are carried out on each partition individually. This was initially difficult and laborious as reactions needed to be divided across multiple compartments (tubes), but the development of emulsion technologies enabled the reaction to be compartmentalized in nanodroplets within a single tube (Diehl et al., 2006). In common with qPCR protocols, fluorescence is incorporated into the target amplicon; however, instead of monitoring fluorescence intensity at a specific cycle during the exponential phase of the reaction, the presence or absence of fluorescence (and therefore the target) at the reaction endpoint is determined for each partition. The copy number of the target gene is calculated by determining the fraction of partitions in which the target gene was amplified relative to a reference gene of known copy number. As each partition is scored for the presence of fluorescence, dPCR achieves precise quantitation of the transgene copy number. Confidence is improved by increasing population size (counting more partitions), resulting in the accuracy of copy number estimation by dPCR being reported as superior to qPCR and comparative with sequencing techniques (Abyzov et al., 2012). In recent years, a number of commercial platforms that divide reactions into tens of thousands of compartments using emulsion technology (digital droplet PCR; ddPCR) or microfluidics chips have been successfully applied for the accurate determination of transgene copy number in different plant species (Glowacka et al., 2016; Collier et al., 2017; Giraldo et al., 2019; Cai et al., 2020). Below, we describe a ddPCR protocol used to determine the transgene copy number in Arabidopsis plants (Cai et al., 2020).
Materials and Reagents
ddPCR set-up and droplet generation
1. PCR Plate Heat Seal, foil, pierceable (Bio-Rad, catalog number: 1814040)
2. DG8TM Cartridge for QX200TM/QX100TM Droplet Generator (Bio-Rad, catalog number: 1864008)
3. Droplet Generator DG8TM Gasket (Bio-Rad, catalog number: 1863009)
4. ddPCR Plates, 96-Well, Semi-Skirted (Bio-Rad, catalog number: 12001925)
5. QubitTM dsDNA HS Assay kit (ThermoFisher Scientific, catalog number: Q32851)
6. Restriction endonuclease with a recognition site within the transgene but not between the primer sites (see procedure for details) and compatible digestion buffer
7. QX200TM ddPCR TM EvaGreen Supermix (Bio-Rad, catalog number: 1864033)
8. QX200 Droplet Generation Oil for EvaGreen® (Bio-Rad, catalog number: 1864005)
Equipment
ddPCR set-up and droplet generation
1. QubitTM 4 fluorometer (ThermoFisher Scientific, catalog number: Q33238)
2. QX200TM droplet generator (Bio-Rad, catalog number: 1864002)
3. Thermal cycler (e.g., Bio-Rad C1000 Touch thermal cycler, catalog number: 1851148)
4. Multichannel pipettes (10-100 µl)
5. Heat sealer (e.g., Eppendorf S100, catalog number: 5391000036)
6. DG8 cartridge holder (Bio-Rad, catalog number: 1863051)
7. QX200 droplet reader (Bio-Rad, catalog number: 1864003)
8. Droplet reader plate holder (Bio-rad, catalog number: 12006834)
Software
1. Primer design software, e.g., Primer 3 (https://primer3.ut.ee/)
2. Sequence analysis software, e.g., Benchling (https://benchling.com)
3. QuantaSoft software (Bio-Rad, catalog number: 1863007)
4. Software capable of reading comma-separated values (.csv) files (e.g., Microsoft Excel)
5. Droplet DigitalTM PCR Applications Guide
http://www.bio-rad.com/webroot/web/pdf/lsr/literature/Bulletin_6407.pdf
Procedure
In this procedure, transgene copy number is determined by performing two PCR reactions for each sample. The first amplifies a region of the transgene (target gene), and the second amplifies a region of an endogenous gene of known copy number (reference gene). An alternative method is multiplex amplification of the target and reference gene using hydrolysis probes for detection; primers and probes for several plant reference genes have been previously reported (Collier et al., 2017).
A. Primer design and selection of restriction endonuclease
1. Use primer design software (e.g., Primer 3) to select primers that amplify a 100-120 base pair region of both the transgene target and reference gene. Primers should optimally have annealing temperatures of ~60°C, similar estimated binding kinetics, and minimal dimerization.
2. Check that each primer pair efficiently amplifies the desired target in a test PCR reaction. Include control reactions with (i) genomic DNA from a wild-type non-transgenic plant, and (ii) no DNA. Assemble the reaction as shown in Table 1.
Table 1. PCR reaction for testing ddPCR primer pairs
|
Components |
Stock concentration |
Final concentration |
Volume |
|
2× QX200TM ddPCRTM EvaGreen® Supermix |
2× |
1× |
5 μl |
|
Forward Primer |
2 μM |
250 nM |
1.25 μl |
|
Reverse Primer |
2 μM |
250 nM |
1.25 μl |
|
Genomic DNA |
5-50 ng (≤ 2.5 μl) |
||
|
Nuclease-free Water |
Bring reaction volume to 10 μl |
||
|
Total |
10 µl |
3. Incubate the PCR reaction using the cycling conditions recommended by the reagent manufacturer, provided in Table 2.
Table 2. PCR cycling conditions for testing ddPCR primer pairs. Use a 2°C/s ramping rate for all steps.
|
Step |
Temperature, °C |
Time |
Number of cycles |
|
Enzyme Activation and Thermosetting |
95 |
5 min |
1 |
|
Denaturation |
95 |
30 s |
40 |
|
Annealing |
60 |
50 s |
|
|
Extension |
72 |
50 s |
|
|
Signal Stabilization |
4 |
5 min |
1 |
|
90 |
5 min |
1 |
|
|
Hold |
4 |
∞ |
1 |
4. Visualize the PCR products by agarose gel electrophoresis, ensuring that single clear bands of the expected sizes are obtained for both sets of primers.
5. Digesting genomic DNA before amplification will ensure that, even if there are two copies of the transgene inserted in tandem, each copy will be on a separate DNA molecule and therefore in a separate droplet. Analyze the transgene sequence for the presence of restriction endonuclease (RE) recognition sequences using sequence analysis software (e.g., Benchling). Select an RE with at least one recognition site within the transgene but no sites between the primers of either the target or reference gene. Avoid the use of restriction endonucleases sensitive to methylation.
B. ddPCR set-up
1. Good quality genomic DNA is required for ddPCR. A cetyltrimethylammonium bromide (CTAB)-based method or a commercial plant DNA extraction kit will provide sufficiently pure genomic DNA. Each ddPCR reaction will generally require 5-50 ng genomic DNA.
Notes:
a. To accurately quantitate DNA concentration, we recommend the use of a Qubit fluorometer.
b. The exact quantity of genomic DNA used in each reaction needs to be optimized for the genome size of the organism.
2. Digest each sample of genomic DNA using the selected RE. An example restriction digestion reaction is shown in Table 3. Different quantities of enzyme and buffer will be required depending on the manufacturer and concentration of the enzyme. Aim to include ~10-30 U enzyme per μg genomic DNA.
Note: The EvaGreen® product notes indicate that digestion of genomic DNA can also be performed by adding 1 μl (2-5 U) desired restriction endonuclease to the PCR reaction.
Table 3. Example reaction for restriction endonuclease digestion of genomic DNA
|
Components |
Volume |
|
10× Restriction Enzyme Buffer |
1 μl |
|
Restriction Enzyme (10-20 U/μl) |
0.5-3 μl |
|
Genomic DNA |
200 ng |
|
Nuclease-free Water |
Bring reaction volume to 10 μl |
|
Total |
10 μl |
3. Inactivate the RE by heating. The exact temperature and length of incubation will depend on the specific enzyme and manufacturer. Following inactivation, the digested genomic DNA can be used directly in the next step without further clean-up.
4. Assemble the PCR reactions in the order shown in Table 4. In addition to the sample reactions, set up control reactions with (i) genomic DNA from a wild-type non-transgenic plant and (ii) no DNA. It is critical that the assembled ddPCR reactions are well mixed prior to proceeding to droplet generation, as every droplet must contain the same concentration of each component.
Table 4. Example ddPCR reaction
|
Components |
Stock concentration |
Final concentration |
Volume |
|
2× QX200TM ddPCRTM EvaGreen® Supermix |
2× |
1× |
11.25 μl |
|
Forward Primer |
2 μM |
250 nM |
2.8 μl |
|
Reverse Primer |
2 μM |
250 nM |
2.8 μl |
|
Genomic DNA (pre- digested) |
5-50 ng (≤ 5.65 μl) |
||
|
Nuclease-free Water |
Bring reaction volume to 22.5 µl |
||
|
Total |
22.5 µl |
Note: If multiple samples are being analyzed, as for other PCR methods, it is recommended to make a master mix and dilute concentrated DNA prior to assembling the ddPCR reaction.
C. Droplet generation
1. Open a DG8 TM Cartridge Holder by pressing the middle latches.
2. Insert the DG8TM Cartridge into the holder and close the holder by pressing the two halves together (Figure 1).
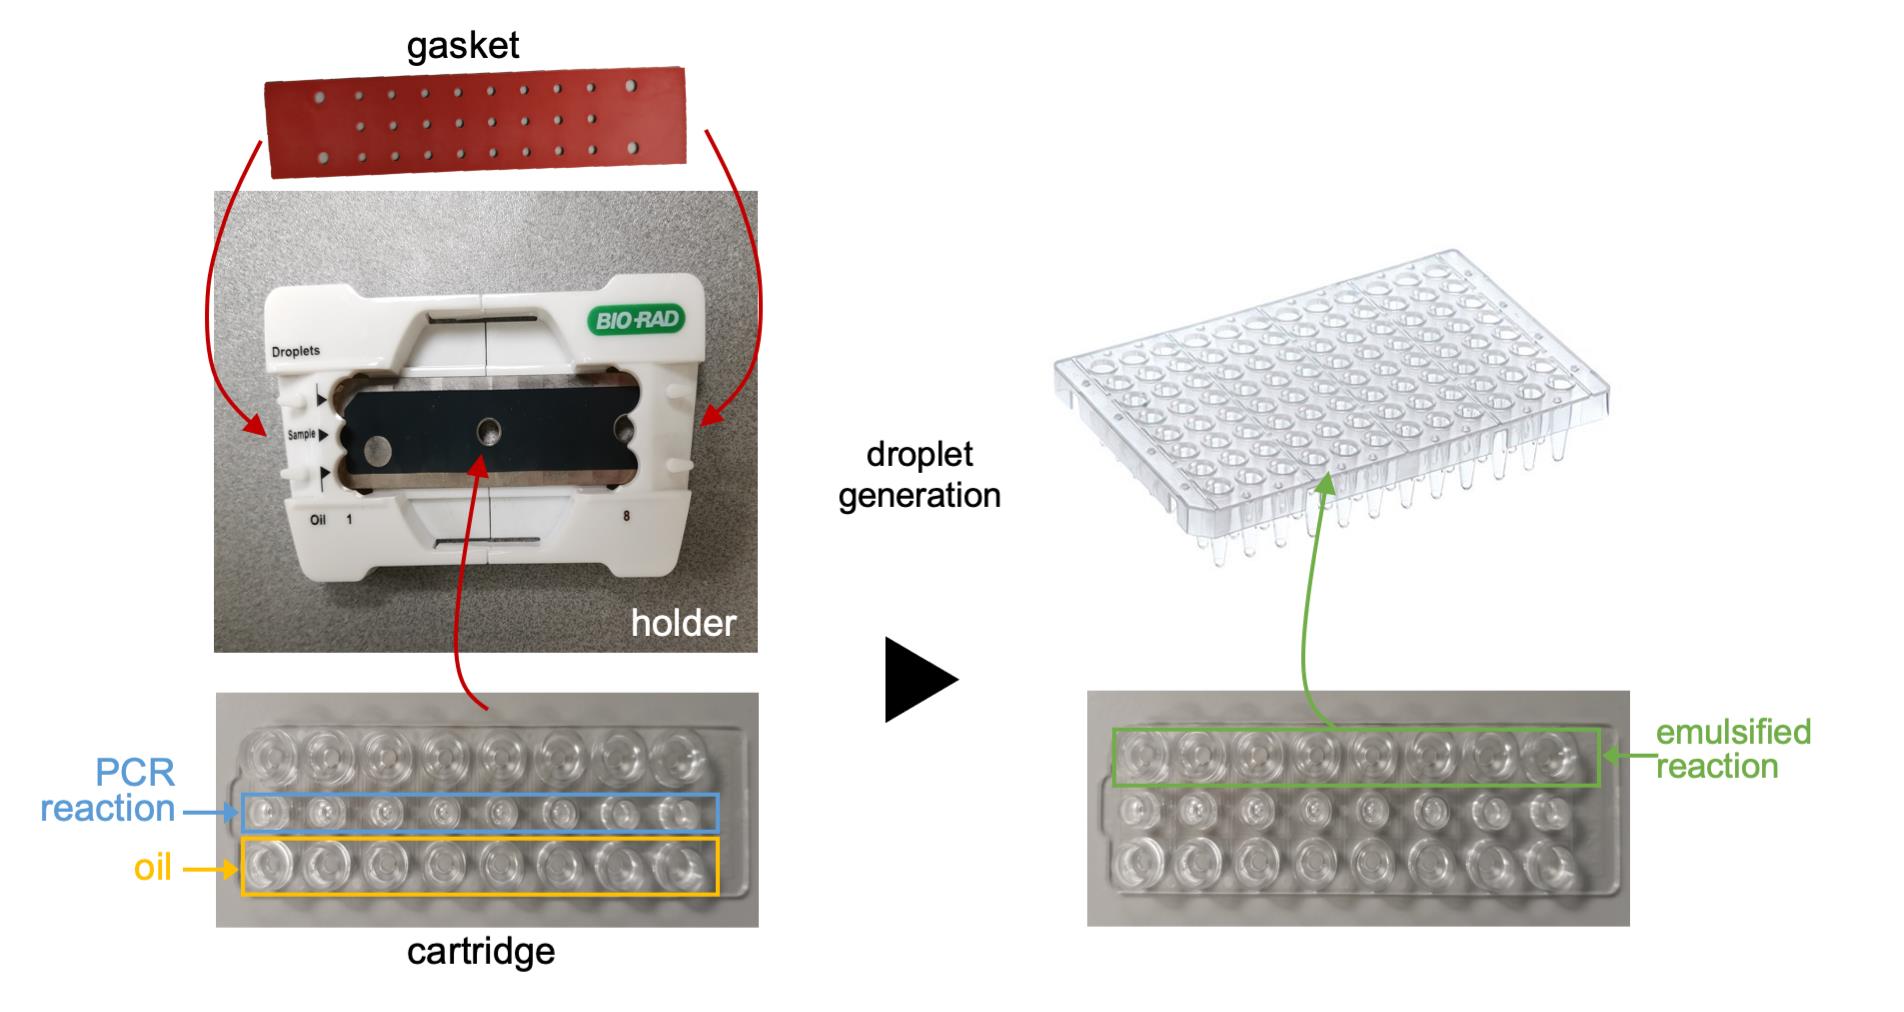
Figure 1. Workflow of droplet generation. The PCR reactions and oil are added to a cartridge, which is inserted into the holder and held in place by the gasket. Following droplet generation, the emulsified reactions are transferred to a microtiter plate for thermal cycling.
3. Load each 20-µl reaction assembled in the previous step into individual sample wells of a DG8TM Cartridge using a multichannel pipette.
4. Add 70 μl QX200 Droplet Generation Oil for EvaGreen® into the oil wells.
5. Cover the cartridge with the DG8TM Gasket. Loop the holes of the gasket over the four hooks on the cartridge holder to hold the gasket in place.
6. Open the DG8 droplet generator and insert the cartridge holder. Close the lid by pressing the button. The generator will start automatically.
7. Transfer the entire volume of the droplet emulsion (typically 40 μl) to the desired wells of a semi-skirted 96-well ddPCR plate (Figure 1). Cover the plate with a pierceable foil plate heat seal and attach using a plate-sealer according to the manufacturer’s instructions. Rotate the plate and repeat this step to ensure the foil is fully attached.
Note: To avoid disrupting the emulsified droplets, take care to pipette very slowly. Wide-bore pipette tips (or pipette tips with the extremity removed using a blade) can be used.
8. Place the sealed plate into a thermal cycler and use exactly the same cycling conditions as those used in the test PCR (see Table 2). During the initial heat cycle, the oil surrounding each droplet will thermoset.
D. Droplet counting
1. When the PCR cycle is complete, switch on the QX200TM droplet reader and open the QuantaSoftTM software.
2. In the QuantaSoftTM software, start a new experiment (Template > New).
3. Select the wells to be detected and enter the sample names or record the well positions for target and reference genes for each sample.
4. Select the key parameters in the well editor as follows:
a. Experiment: ABS (absolute quantitation).
Note: The QuantaSoftTM software provides three default experiments: Absolute Quantitation (ABS), Rare Event Detection (RED), and Copy Number Variation (CNV). Both ABS and CNV can be used for copy number determination. For CNV mode, a known reference gene copy number needs to be provided. The ABS mode is more flexible. For example, the copy number of the reference gene is not required, and the relative ratio of target and reference can be calculated.
b. Supermix: QX200TM ddPCR EvaGreen Supermix.
c. Target 1 type: Ch1 Unknown.
d. Target 2 type: Ch2 Unknown.
e. Name: Enter sample names, e.g., transgenic line x, reference gene. This can help to distinguish which wells are for transgene and which are for reference genes.
5. Apply the chosen parameters to the selected wells by clicking ‘OK’.
6. Remove the PCR plate from the thermocycler and insert into the base of a plate-reader holder. Cover the plate with the lid and press the latches to lock the holder.
7. Open the QX200TM droplet reader, insert the plate-reader holder, and close the lid.
8. Check that the indicator lights for ‘power’, ‘bottle levels’, and ‘plate in place’ are green.
9. Click ‘Run’ in the QuantaSoftTM software. Select EvaGreen in the ‘Run Option’ dialog. Click OK to start the reading.
Data analysis
1. When reading is complete, click on ‘Analysis’.
2. Click the ‘1D amplitude’ button to view the distribution of positive and negative droplets. An example distribution is shown in Figure 2.
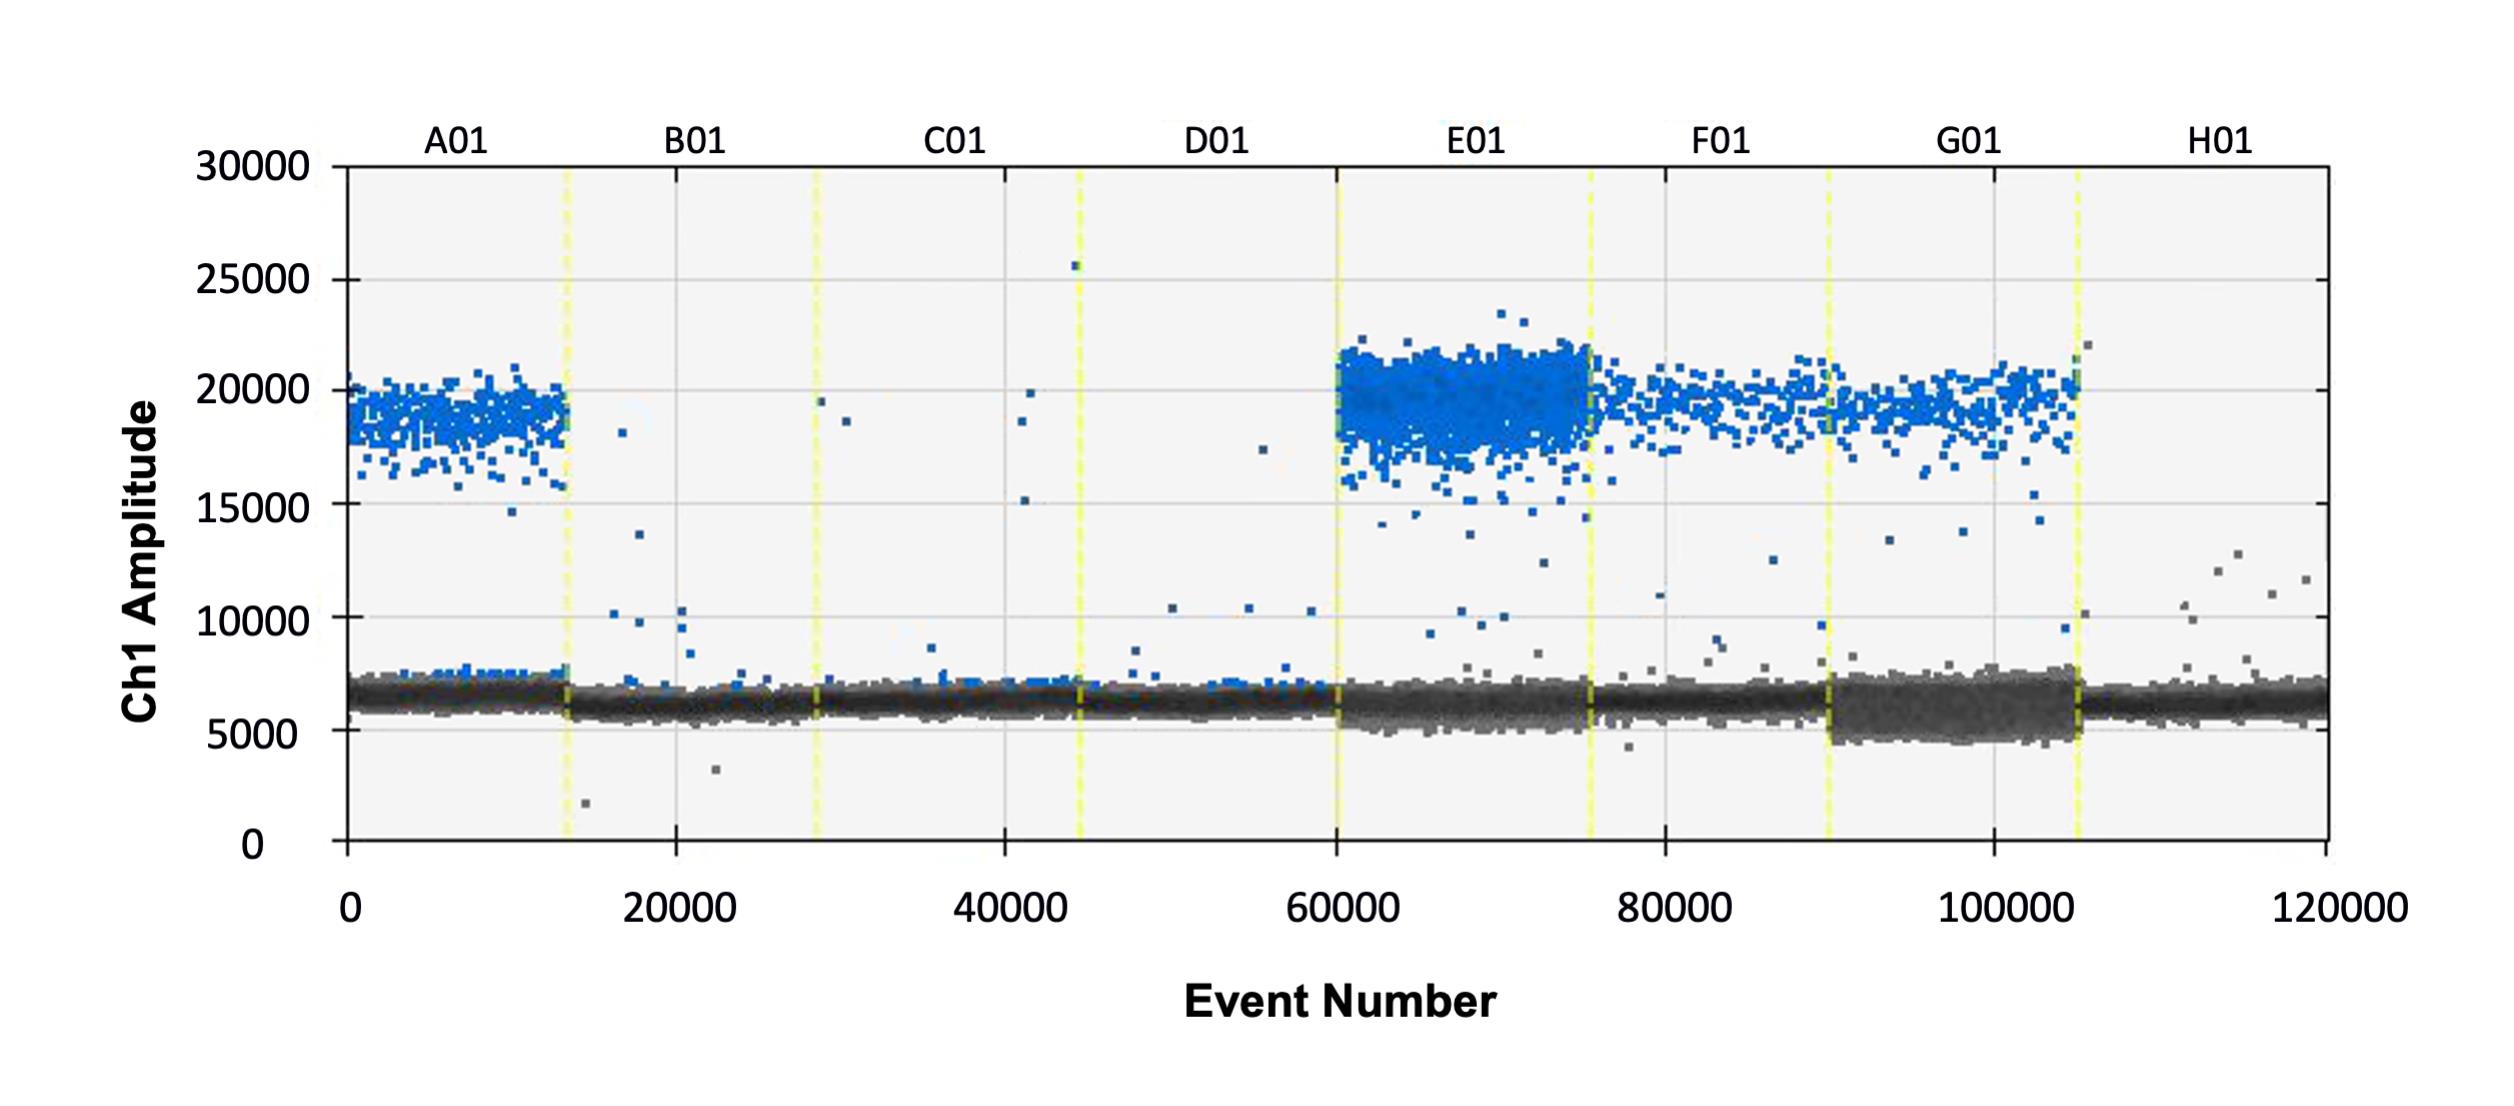
Figure 2. Example plot showing positive (blue) and negative (grey) droplets for eight samples (A01-H01). The X-axis (event number) indicates the number of droplets measured across the total experiment, and the Y-axis shows the amplitude of fluorescence.
Note: A single reaction should produce 12,000-20,000 droplets. The calculation of copy number relies on the ratio of positive to negative droplets. If the positive droplets saturate (most droplets are positive), this means that every droplet had the target molecule and it is likely that either the primers are non-specific or too much DNA was used in the reaction. To obtain an accurate result, primer specificity should be checked and/or the reactions repeated with less DNA.
3. The threshold, which distinguishes positive droplets from negative droplets, as well as the concentration value, is automatically determined; however, if desired, the threshold can be manually adjusted.
4. Click the “Concentration” button. Export the concentration data as a comma-separated values (.csv) file.
5. Open the .csv file in the appropriate software (e.g., Microsoft Excel). Any sample names provided in the QuantaSoftTM software will be in the ‘Sample’ column. The ‘Concentration’ column contains the number of PCR amplicons per μl required to calculate copy number.
6. The copy number of the target gene is calculated by (Ctarget/Cref) * Nref, where Ctarget is the concentration of the transgene, Cref is the concentration of the endogenous gene, and Nref is the copy number of the reference gene. In the example provided in Table 5, the reference gene is a single copy homozygous gene in the Arabidopsis genome; thus, there are two copies in each of the diploid somatic cells from which DNA was extracted. In line 1, the concentration of the target (Ctarget) is 115 copies/μl, and the concentration of the reference is (Cref) is 227 copies/μl. Therefore, the copy number of the transgene is (115/227)*2 = 1.0, meaning that line 1 has a single copy of the transgene (hemizygous). In line 2, Ctarget = 784 copies/μl and Cref = 173 copies/μl. Therefore, the copy number of the transgene is (784/173)*2 = 9.1, meaning that line 2 has nine copies of the transgene. In line 3, Ctarget = 11.7 copies/μl and Cref = 333 copies/μl. Therefore, the copy number of the target transgene is (11.7/333)*2 = 0.07 copies, which means that line 3 is unlikely to contain a transgene.
Note: When determining transgene copy numbers in polyploid plants, many endogenous genes typically presenting as a single-copy gene may be present on multiple genomes. For example, there may be four copies of a typical single-copy reference gene in the diploid cells of a tetraploid plant; therefore, the concentration value for a single-copy hemizygous transgene will be one quarter of the reference gene. The method described above can also be used for determining transgene zygosity in progeny generations; however, since the ddPCR protocol will only provide raw values, knowledge of the copy number of the parent line(s) will be required. For example, if the diploid cells of a progeny plant are estimated to contain six copies, knowledge of the copy number of any parental line(s) is required to determine whether the plant has six independent hemizygous loci or three homozygous loci.
Table 5. Example ddPCR data from three transgenic plants (Lines 1-3) showing the number of positive and negative droplets obtained in which the transgene (target) and a known-copy endogenous gene (ref) were amplified. The column showing the concentration (number of PCR amplicons per μl) is used to calculate the copy number.
|
Well |
ExptType |
Sample |
Status |
Concentration |
Supermix |
Positives |
Negatives |
|
A01 |
Absolute Quantitation |
Line 1 target |
OK |
115 |
QX200 ddPCR EvaGreen Supermix |
1648 |
16017 |
|
A02 |
Absolute Quantitation |
Line 1 ref |
OK |
227 |
QX200 ddPCR EvaGreen Supermix |
3283 |
15412 |
|
B01 |
Absolute Quantitation |
Line 2 target |
OK |
784 |
QX200 ddPCR EvaGreen Supermix |
8398 |
8869 |
|
B02 |
Absolute Quantitation |
Line 2 ref |
OK |
173 |
QX200 ddPCR EvaGreen Supermix |
2321 |
14615 |
|
C01 |
Absolute Quantitation |
Line 3 target |
OK |
11.7 |
QX200 ddPCR EvaGreen Supermix |
113 |
11313 |
|
C02 |
Absolute Quantitation |
Line 3 ref |
OK |
333 |
QX200 ddPCR EvaGreen Supermix |
3061 |
9346 |
Acknowledgments
We thank Oleg Raitskin for technical help and Simon Foster for equipment maintenance. We acknowledge financial support from the UK Biotechnology and Biological Sciences and the Engineering and Physics Research Councils (BBSRC and EPSRC) synthetic biology for growth program (OpenPlant Synthetic Biology Research Centre BB/L014130/1), as well as grants BBS/E/T/000PR9816 and BB/R021554/1. This protocol was developed to generate the transgene copy number data presented in Cai (2020).
Competing interests
No competing interests to declare.
References
1. Abyzov, A., Mariani, J., Palejev, D., Zhang, Y., Haney, M.S., Tomasini, L., Ferrandino, A.F., Rosenberg Belmaker, L.A., Szekely, A., Wilson,M., Kocabas, A., Calixto, N.E., Grigorenko, E.L., Huttner, A. Chawarska, K., Weissman, S., Urban, A.E., Gerstein, M. and Vaccarino, F.M. (2012). Somatic copy number mosaicism in human skin revealed by induced pluripotent stem cells. Nature 492(7429): 438-442.
2. Ahuja, M. R. and Fladung, M. (2014). Integration and inheritance of transgenes in crop plants and trees. Tree Genet Genomes 6(4): 155-9.
3. Altpeter, F., Springer, N.M., Bartley, L.E., Blechl, A.E., Brutnell, T.P., Citovsky, V., Conrad, L.J., Gelvin, S.B., Jackson, D.P., Kausch, A.P., Lemaux, P.G., Medford, J.I., Orozco-Cárdenas, M.L., Tricoli, D.M., Van Eck, J., Voytas, D.F., Walbot, V., Wang, K., Zhang, Z.J. and Stewart, C.N. Jr. (2016). Advancing crop transformation in the era of genome editing. Plant Cell 28(7): 1510-1520.
4. Boutigny, A.-L., Fioriti, F. and Rolland, M. (2020). Targeted MinION sequencing of transgenes. Sci Rep 10(1): 15144.
5. Bubner, B. and Baldwin, I. T. (2004). Use of real-time PCR for determining copy number and zygosity in transgenic plants. Plant Cell Rep 23(5): 263-71.
6. Cai, Y.M., Kallam, K., Tidd, H., Gendarini, G., Salzman, A. and Patron, N.J. (2020). Rational design of minimal synthetic promoters for plants. Nucleic Acids Res 48(21): 11845-11856.
7. Cantsilieris, S., Baird, P. N. and White, S. J. (2013). Molecular methods for genotyping complex copy number polymorphisms. Genomics 101(5): 86-93.
8. Collier, R., Dasgupta, K., Xing, Y.-P., Hernandez, B.T., Shao, M., Rohozinski, D., Kovak, E., Lin, J., de Oliveira, M.L.P., Stover, E., McCue, K.F., Harmon, F.G., Blechl, A., Thomson, J.G. and Thilmony, R. (2017). Accurate measurement of transgene copy number in crop plants using droplet digital PCR. The Plant J 90(5): 1014-1025.
9. Diehl, F., Li, M., He, Y., Kinzler, K.W., Vogelstein, B. and Dressman, D. (2006). BEAMing: single-molecule PCR on microparticles in water-in-oil emulsions. Nat Methods 3(7): 551-559.
10. Giraldo, P.A., Cogan, N.O.I., Spangenberg, G.C., Smith, K.F. and Shinozuka, H. (2019). Development and Application of Droplet Digital PCR Tools for the Detection of Transgenes in Pastures and Pasture-Based Products. Front Plant Sci 9: 1923.
11. Glowacka, K., Kromdijk, J., Leonelli, L., Niyogi, K. K., Clemente, T. E. and Long, S. P. (2016). An evaluation of new and established methods to determine T-DNA copy number and homozygosity in transgenic plants. Plant Cell Environ 39(4): 908-917.
12. Golicz, A. A., Bayer, P. E. and Edwards, D. (2015). Skim-based genotyping by sequencing. Methods Mol Biol 1245: 257-270.
13. Guo, B., Guo, Y., Hong, H. and Qiu, L.J. (2016). Identification of Genomic Insertion and Flanking Sequence of G2-EPSPS and GAT Transgenes in Soybean Using Whole Genome Sequencing Method. Front Plant Sci 7: 1009.
14. Guttikonda, S.K., Marri, P., Mammadov, J., Ye, L., Soe, K., Richey, K., Cruse, J., Zhuang, M., Gao, Z., Evans, C., Rounsley, S. and Kumpatla, S.P. (2016). Molecular Characterization of Transgenic Events Using Next Generation Sequencing Approach. PLOS ONE 11(2): e0149515.
15. Hobbs, S. L. A., Warkentin, T. D. and DeLong, C. M. O. (1993). Transgene copy number can be positively or negatively associated with transgene expression. Plant Mol Biol 21(1): 17-26.
16. Kim, C., Guo, H., Kong, W., Chandnani, R., Shuang, L.S. and Paterson, A.H. (2016). Application of genotyping by sequencing technology to a variety of crop breeding programs. Plant Sci 242(2016): 14-22.
17. Lepage, É., Zampini, É., Boyle, B. and Brisson, N. (2013). Time- and Cost-Efficient Identification of T-DNA Insertion Sites through Targeted Genomic Sequencing. PLoS ONE 8(8): e70912.
18. Li, S., Jia, S., Hou, L., Nguyen, H., Sato, S., Holding, D., Cahoon, E., Zhang, C., Clemente, T. and Yu, B. (2019). Mapping of transgenic alleles in soybean using a nanopore-based sequencing strategy. J Exp Bot 70(15): 3825-3833.
19. Li, Z., Hansen, J.L., Liu, Y., Zemetra, R.S. and Berger, P.H. (2004). Using real-time PCR to determine transgene copy number in wheat. Plant Mol Biol Rep 22(2): 179-188.
20. Mieog, J. C., Howitt, C. A. and Ral, J. P. (2013). Fast-tracking development of homozygous transgenic cereal lines using a simple and highly flexible real-time PCR assay. BMC Plant Biology 13(1): 71.
21. Pfaffl, M. W. (2001). A new mathematical model for relative quantification in real-time RT-PCR. Nucleic Acids Res 29(9): e45.
22. Polkoa, J.K., Temannib, M.R., Van Zantena, M., Van Workumb, W., Iburga, S., Pierika, R., Voeseneka, L.A.C.J. and Peetersa, A.J.M. (2012). Illumina sequencing technology as a method of identifying T-DNA insertion loci in activation- tagged Arabidopsis thaliana plants. Molecular Plant 5(4): 948-950.
23. Sivamani, E., Li, X., Nalapalli, S., Barron, Y., Prairie, A., Bradley, D., Doyle, M. and Que, Q. (2015). Strategies to improve low copy transgenic events in Agrobacterium-mediated transformation of maize. Transgenic Res 24(6): 1017-1027.
24. Southern, E. M. (1975). Detection of specific sequences among DNA fragments separated by gel electrophoresis. J Mole Biol 98(3): 503–517.
25. Vogelstein, B. and Kinzler, K. W. (1999). Digital PCR. Proc Natl Acad Sci U S A 96(16): 9236-9241.
26. Wang, J. W., Grandio, E. G., Newkirk, G. M., Demirer, G. S., Butrus, S., Giraldo, J. P. and Landry, M. P. (2019). Nanoparticle-Mediated Genetic Engineering of Plants. Mol Plant 12(8): 1037-1040.
27. Weng, H., Pan, A., Yang, L., Zhang, C., Liu, Z. and Zhang, D. (2004). Estimating number of transgene copies in transgenic rapeseed by real-time PCR assay with HMG I/Y as an endogenous reference gene. Plant Mol Biol Rep 22(3): 289-300.
28. Yang, L., Chen, J., Huang, C., Liu, Y., Jia, S., Pan, L. and Zhang, D. (2005a). Validation of a cotton-specific gene, Sad1, used as an endogenous reference gene in qualitative and real-time quantitative PCR detection of transgenic cottons. Plant Cell Rep 24(4): 237-245.
29. Yang, L., Ding, J., Zhang, C., Jia, J., Weng, H., Liu, W. and Zhang, D. (2005b). Estimating the copy number of transgenes in transformed rice by real-time quantitative PCR. Plant Cell Rep 23(10-11): 759-763.
30. Yi, C. and Hong, Y. (2019). Estimating the copy number of transgenes in transformed cotton by real-time quantitative PCR. Methods in Molecular Biology. Humana Press Inc., pp. 137-157.
中文翻译见下页