今天浏览简书文章找到一个特别好用的工具RISmed包,参考信息:
https://www.jianshu.com/p/1544070a95e1
https://mp.weixin.qq.com/s/M07PmoTA2IOvI1cn1C_fGQ
来看一下,自己关注的研究领域近10年的研究情况
rm(list = ls())
 options(stringsAsFactors = F)
 library(RISmed)
 限定下检索主题
 search_topic <- c('PAH-CHD')
 search_query <- EUtilsSummary(search_topic,db="pubmed", retmax=10000,datetype='pdat', mindate=2010, maxdate=2020)
 查查看下检索内容
 summary(search_query)
 看下这些文献的Id
 QueryId(search_query)
 获取检索结果
 records<- EUtilsGet(search_query)
 class(records)
 str(records)
 提取检索结果
 pubmed_data <- data.frame('Title'=ArticleTitle(records),
                           'Year'=YearAccepted(records),
                           'journal'=ISOAbbreviation(records))
 head(pubmed_data,1)
 pubmed_data[1:3,1]
 write.csv(pubmed_data,file='PAH-CHD.csv')
 分析文章情况
 y <- YearPubmed(EUtilsGet(search_query))
 可视化一下
 library(ggplot2)
 date()
 count <- table(y)
 count <- as.data.frame(count)
 names(count)<-c("Year", "Counts")
 library(RColorBrewer)
 library(ggsci)
 ggplot(data=count, aes(x=Year, y=Counts,fill=Year)) +
   geom_bar(stat="identity", width=0.5)+
   labs(y = "Number of articles",title="PubMed articles containing PAH-CHD"
   ) + theme_bw() + scale_fill_manual(values = colorRampPalette(brewer.pal(10, "Accent"))(10)) +
   theme(legend.position="bottom")
基本上我就是参考了

他的代码完成了这个操作,这里需要注意的是,由于他查找的内容比我的多很多,我这个输出94篇论文,他查找的是别的课题有40000多篇论文,所以可视化以后得到的图肯定是比我这个大很多,因此作图的参数不太一样,但是我暂时也用不着这个图做汇报,就没有更改具体参数。
使用这个RISmed包需要先安装ggplot2,RColorBrewer,ggsci,因为在可视化的过程中需要用到。
最后得到结果如下图所示
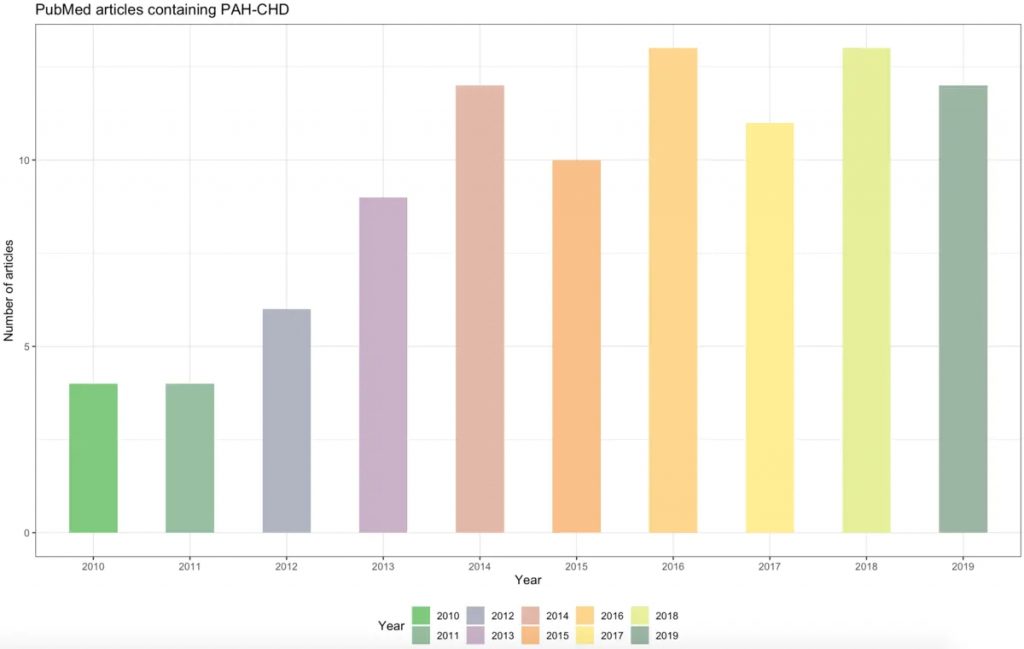
10年PAH-CHD
根据Rstudio的提示稍微更改一下参数,得到的图片就会相应的改变
library(ggsci)ggplot(data=count, aes(x=Year, y=Counts,fill=Year)) + geom_bar(stat="identity", width=0.5)+ labs(y = "Number of articles",title="PubMed articles containing PAH-CHD" ) + theme_bw() + scale_fill_manual(values = colorRampPalette(brewer.pal(10, "Accent"))(10)) + theme(legend.position="bottom")
作者:程凉皮儿
链接:https://www.jianshu.com/p/acd90e28c2bb
来源:简书
著作权归作者所有。