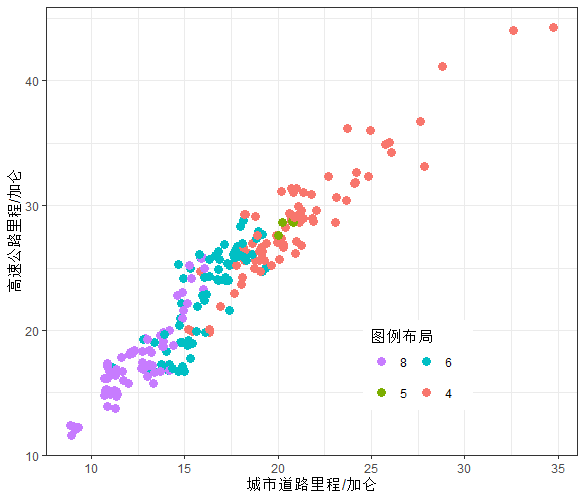
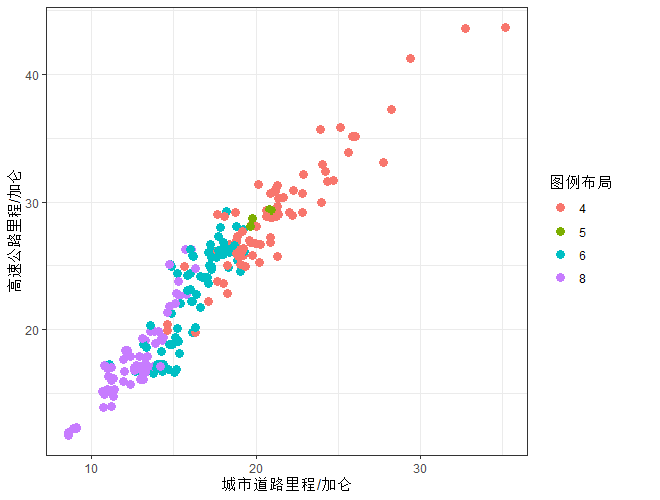
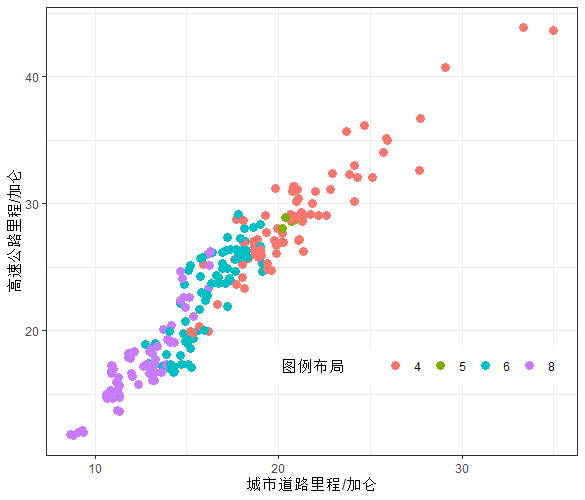
 p <-
   ggplot(mpg, aes(cty, hwy, color = factor(cyl))) +
   geom_jitter(size=3) +
   labs(x = "城市道路里程/加仑",
        y = "高速公路里程/加仑",
        colour = "图例布局") +
  theme(legend.background = element_rect(color = "red"))+
   theme_bw()
# 快捷调整
 p + theme(
   legend.direction = "horizontal",legend.position = c(0.7,0.2)
 )
 p + theme(
   legend.direction = "vertical",legend.position = c(0.7,0.2)
 )
 # 精准调整
 p + guides(
   color = guide_legend(
     ncol = 2,
     byrow = TRUE,
     reverse = T))+
   theme(legend.position = c(0.7,0.2)
 )
# 举一反三:nrow=   也可