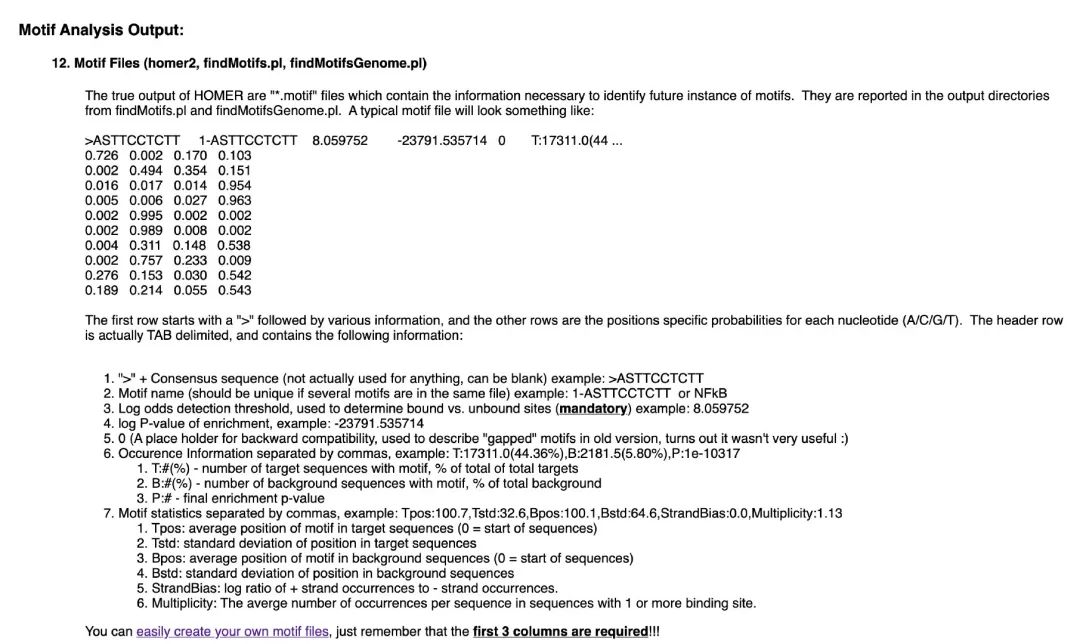
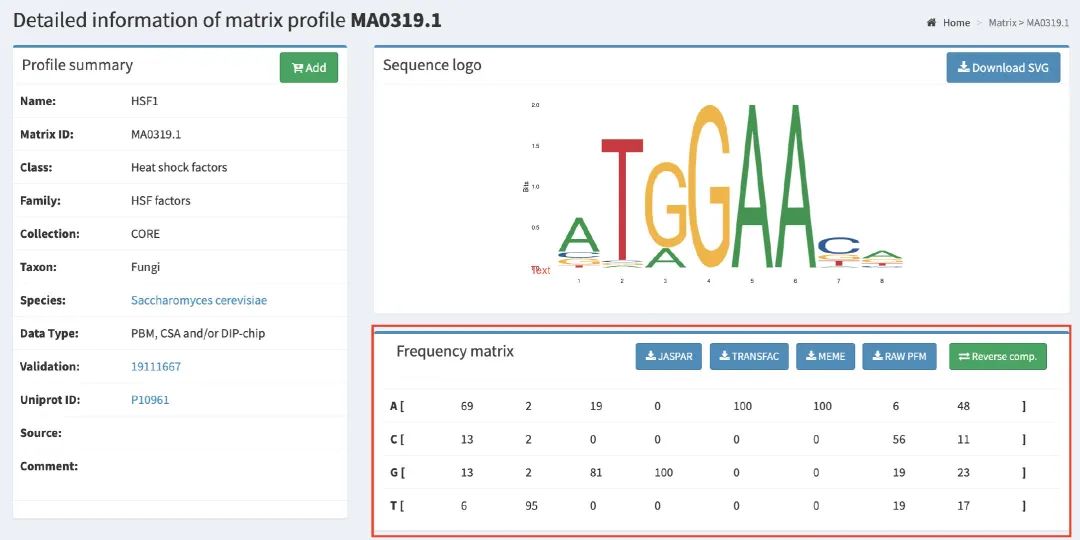
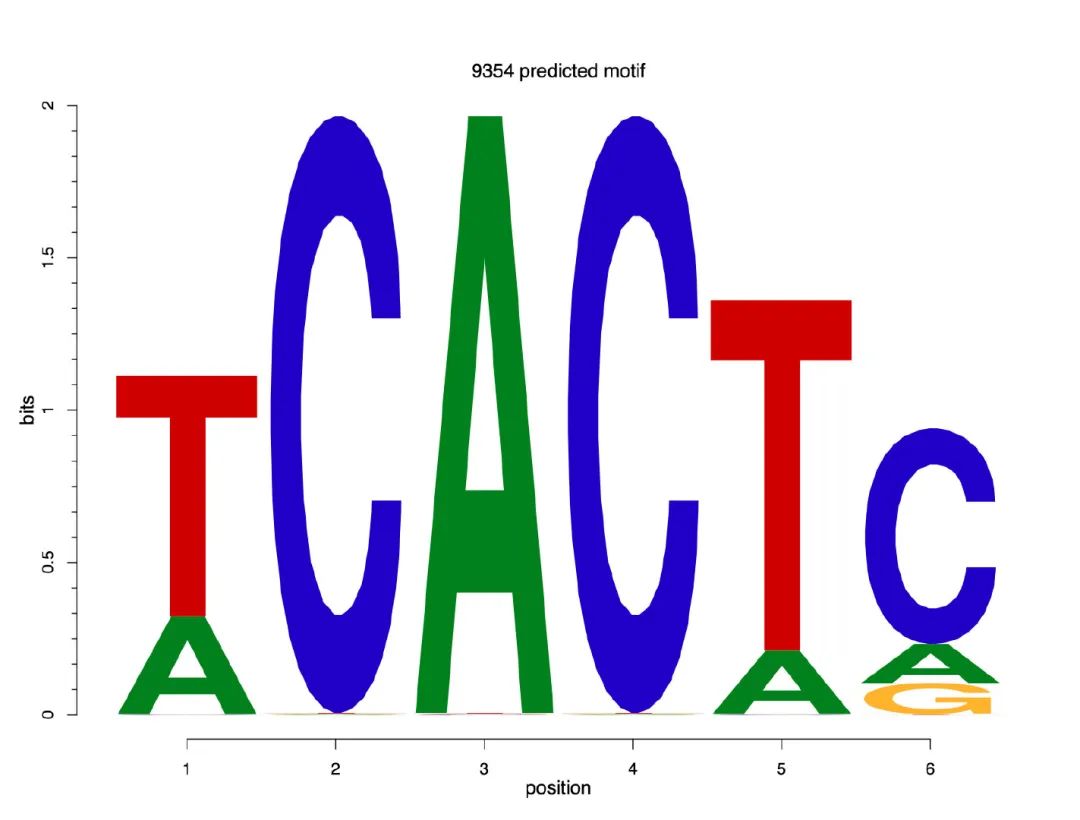
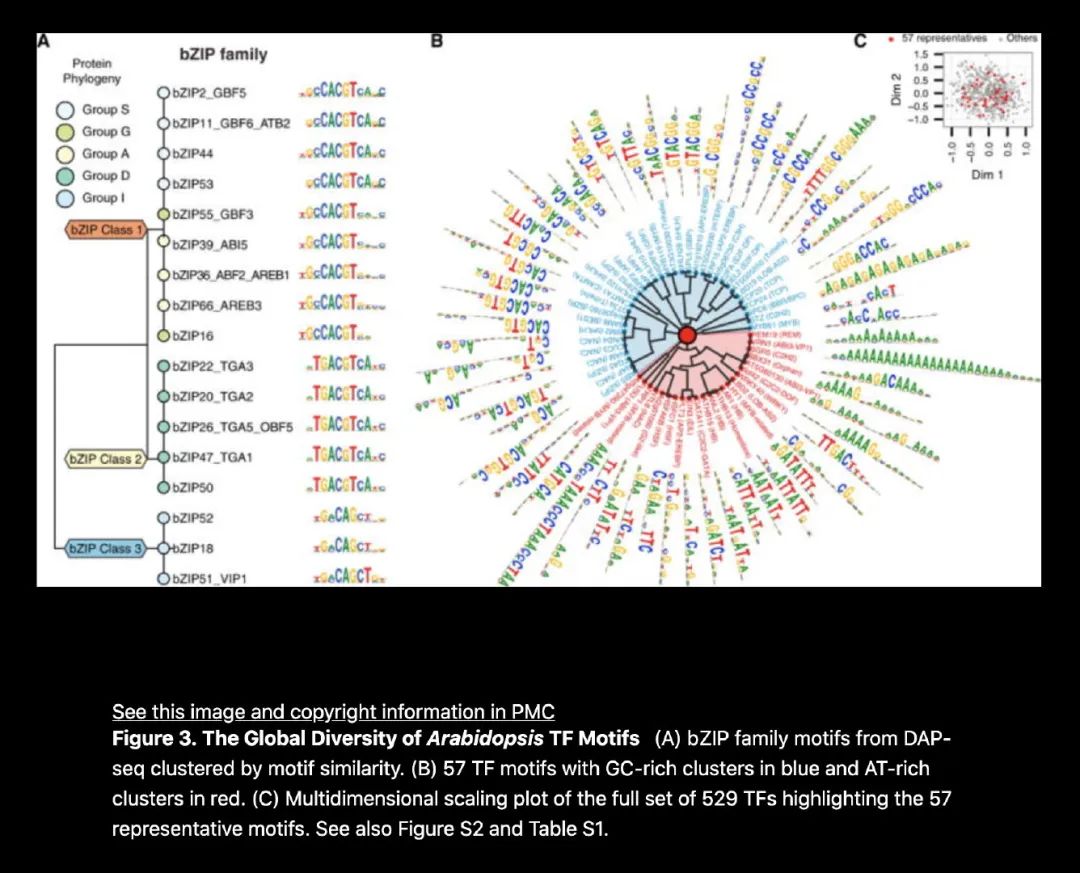
Motif:在生物学中是一个基于数据的数学统计模型,是一段序列也可以是一个结构,是特定的group的序列预测,对DNA来说可以定义为转录因子的结合位点;对蛋白质来说可以定义某个蛋白属于哪个给定的蛋白质家族。
Protein domains:domains是一种结构实体,在蛋白质结构中独立折叠和行驶功能的一部分。因此,蛋白质经常是这些结构域的不同的组合构建起来的。


 1#install motifStack
 2if (!requireNamespace("BiocManager", quietly = TRUE))
 3  install.packages("BiocManager")
 4BiocManager::install("motifStack")
 5library(motifStack)
 6?motifStack
 7#rebild data format
 8motiffile <- read.table("/Users/hejieqiang/Desktop/motif1.motif")
 9names(motiffile) <- c("A","C","G","T")
10A <- motiffile[,1]
11C <- motiffile[,2]
12G <- motiffile[,3]
13T <- motiffile[,4]
14data <- rbind(A,C,G,T)
15pcm <- data[,1:ncol(data)]
16#plot
17rownames(pcm) <- c("A","C","G","T")
18motif <- new("pcm", mat=as.matrix(pcm), name="bin_SOLEXA")
19opar<-par(mfrow=c(4,1))
20par(opar)
21plot(motif)

brew install ghostscript,但是你真的不知道homebrew有多慢?;因为brew install基于git,github在国外的网络,所以这个断断续续的搞了一个多小时;之后安装完我直接试了plot(motif),结果这时候又报错了,网络上是这样说的:
This error can occur in Rstudio simply because your “Plots” pane is just barely too small. Try zooming your “Files, Plots, Packages, Help, Viewer” and see if it helps! If you get this message in RStudio, clicking the ‘broomstick’ figure “Clear All Plots” in Plots tab and trying plot() again may work.
par(opar),在运行就有结果了!

虽然晚点了,
但是看到朋友圈秀恩爱的和领结婚证的
祝幸福久久!