原文转自:《mRNA Stability Assay Using Transcription Inhibition by Actinomycin D in Mouse Pluripotent Stem Cells》 from bio-protocol
Abstract
Gene expression is regulated through multiple steps at both transcriptional and post-transcriptional levels. The net abundance of mature mRNA species in cells is determined by the balance between transcription and degradation. Thus, the regulation of mRNA stability is a key post-transcriptional event that can greatly affect the net level of mRNAs in cells. The mRNA stability within cells can be measured indirectly by analyzing the mRNA half-life following transcription inhibition, where changes in mRNA levels are assumed to reflect mRNA degradation. Determination of mRNA half-life as a measure of mRNA stability is useful in understanding gene expression changes and underlying mechanisms regulating the level of transcripts at different physiological conditions or developmental stages. The protocol described here presents the analysis of mRNA decay as a measure for determining mRNA stability after transcriptional inhibition with Actinomycin D treatment in control and SRSF3 depleted mouse induced pluripotent stem cells (iPSC).
Keywords: mRNA stability (mRNA稳定性), Actinomycin D (放线菌素 D), mRNA decay (mRNA降解), Transcription inhibitors (转录抑制剂), mRNA half-life (mRNA半衰期)
Background
Determining the stability of mRNA within cells provides an important measure for understanding post-transcriptional gene regulation and the potential role of RNA-protein interactions in the process. Under any specific condition such as following extracellular stimuli or gene knockdown the stability of mRNAs may change due to enhanced degradation or extended half-lives (Shyu et al., 1989). Therefore, to assess mRNA stability, direct measurements of decay rates of endogenous mRNAs have been performed in a number of ways, including kinetic labeling techniques and the use of transcriptional inhibitors (Chen et al., 2008). One of the simplest techniques of measuring mRNA stability is by inhibiting transcription in vivo with transcription inhibitors and measuring the mRNA kinetics.
Actinomycin D is a transcription inhibitor which intercalates into DNA. Actinomycin D forms a very stable complex with DNA, preventing the unwinding of the DNA double-helix, thus inhibiting the DNA-dependent RNA polymerase activity. Actinomycin D is widely used in mRNA stability assays to inhibit the synthesis of new mRNA, allowing the assessment of mRNA decay by measuring mRNA abundance following transcription inhibition (Avendano and Menéndez, 2008). At low concentrations, Actinomycin D inhibits transcription without significantly affecting DNA replication or protein synthesis (Berg et al., 2002). Other transcription inhibitors such as 5,6-dichloro-1β-1-ribofuranosylbenzimidazole (DRB) which interacts directly with the RNA polymerase II have also been successfully used in similar assays (Harrold et al., 1991). Please refer to Bensaude (2011) for more detailed information on different transcription inhibitors that can be used and their specific properties. More advanced techniques such as the use of inducible promoters to control transient transcription have presented advantages over the potential cytotoxic effects of Actinomycin D or other transcription inhibitors in the analysis of mRNA decay (Chen et al., 2008). However, the advantage of Actinomycin D assay is that it does not require the construction and introduction of exogenous genes into cells, and provides a way of measuring stability changes of endogenous mRNAs (Chen et al., 2008).
We have established serine-arginine-rich splicing factor 3 (SRSF3)-RNA interactions as a critical means to co-ordinate gene expression in pluripotent cells (Ratnadiwakara et al., 2018). Further, SRSF3 has been reported to regulate mRNA levels including its own mRNA abundance via alternative splicing coupled to nonsense mediated decay (NMD) (Anko et al., 2012). To determine if SRSF3 affects the production or stability of NMD-sensitive transcript variants in pluripotent cells, we determined mRNA half-lives of SRSF3 target mRNAs in Actinomycin D treated control and SRSF3-depleted pluripotent stem cells (Ratnadiwakara et al., 2018). Several techniques such as Northern blot analysis, in situ hybridization and quantitative PCR can be used to determine the mRNA half-life after transcription inhibition. We used quantitative PCR which allows rapid and sensitive measurement of half-lives of mRNAs across a broad range of expression levels, including low abundant mRNAs. The protocol described here can be used to successfully measure mRNA decay in pluripotent stem cells.
Materials and Reagents
- 6-well cell culture plates (Sigma-Aldrich, catalog number: CLS3516)
- Serological pipettes 10 ml (Sigma-Aldrich, catalog number: CLS4488)
- 15 ml Falcon tubes (Sigma-Aldrich, catalog number: CLS430791)
- Sterile filter pipette tips 10 µl, 20 µl, 200 µl, 1,000 µl (Axygen, catalog numbers: TF10LRS, TF20LRS, TF200LRS and TF1000LRS)
- Microcentrifuge tubes (Axygen, catalog number: MCT-175-C)
- Neptune semi-skirted 96-well plates (VWR, catalog number: 89126-694)
- Optically clear adhesive seal sheets (Thermo Fisher Scientific, catalog number: AB-1170)
- Knock-Out DMEM (Thermo Fisher Scientific, catalog number: 10829018)
- ES cell grade fetal bovine serum (Sigma-Aldrich, catalog number: F9423)
- GlutaMAX (Life Technologies, catalog number: 35050-061)
- Trypsin 0.25% (Life Technologies, catalog number: 25200-056)
- Penicillin-Streptomycin (Life Technologies, catalog number: 15070-063)
- Non-Essential Amino Acids (Life Technologies, catalog number: 11140-050)
- Beta-Mercapto Ethanol (Life-technologies, catalog number: 21985-023)
- Leukaemia inhibitory factor (LIF) (here LIF was produced by the Monash University Protein Production Unit, Australia)
- Phosphate-buffered saline (PBS) (Life Technologies, catalog number: 14190-250)
- Cells in culture (here mouse induced pluripotent stem cells)
- (z)-4-Hydroxytamoxifen (Sigma-Aldrich, catalog number: H7904-5MG)
- Cell culture grade Actinomycin D (Sigma-Aldrich, catalog number: A9415)
- Cell culture grade Dimethyl Sulfoxide (DMSO) (AppliChem, catalog number: A3672,0100)
- TRI Reagent (Sigma-Aldrich, catalog number: T9424)
- Chloroform (Sigma-Aldrich, catalog number: 288306)
- Isopropanol (Sigma-Aldrich, catalog number: 278475)
- RNA grade Glycogen (Thermo Fisher Scientific, catalog number: R0551)
- Ethanol (any molecular grade)
- RNase-free water (Invitrogen, catalog number: 10977-015)
- RQ1 DNase kit (Promega, catalog number: M6101)
- SuperScript III Reverse transcription kit (Thermo Fisher Scientific, catalog number: 18080044)
- RNaseOUT (Thermo Fisher Scientific, catalog number: 10777019)
- Random hexamer primer mix (Bioline, catalog number: BIIO38028)
- OligodT18 (IDT)
- SYBR green master mix, here Luminaries HiGreen qPCR Master Mix, Low ROX (Thermo Fisher Scientific, catalog number: K0974)
- qPCR primers for the genes of interest
- ES culture media (see Recipes)
Equipment
- Sterile cell culture hood (Safemate Vision 1.2 cabinet, catalog number: LDE0820)
- 37 °C cell culture incubator with 10% CO2 and 5% O2 (hypoxia) (Thermo Fisher Scientific, model: HeracellTM 150)
- Automated cell counter (NanoEnTek, catalog number: E1000)
- Refrigerated microcentrifuge (Bio-strategy, catalog number: 75002421)
- qPCR machine (7500 Real-Time PCR System) (Thermo Fisher Scientific, Applied BiosystemsTM, catalog number: 4351105)
- Vortexer
- Freezer
Software
- SDSv2.4 (Thermo Fisher Scientific, www.thermofisher.com/au/en/home/technical-resources/software-downloads/applied-biosystems-7900ht-fast-real-timespcr-system.html)
- GraphPad Prism 7 (GraphPad Sowtware, Inc, www.graphpad.com)
- Microsoft Excel Version 15.41 (Microsoft)
Procedure
- Cell culture and sample generation
- Seed 3 x 10⁵ cells per well in 3 ml of media in each well of a 6-well plate (Figure 1–step 1, in total 6 wells per replicate).
Note: We used mouse induced pluripotent stem cells (iPS cells) generated from reprogrammable tamoxifen inducible SRSF3-knockout and control mouse embryonic fibroblasts (MEFs) (Ratnadiwakara et al., 2018). The culture conditions described here reflect the requirements for these cells. A detailed description of the generation and culture properties of the iPS cell lines used here can be found in (Ratnadiwakara et al., 2018) and the media composition can be found under Recipes. This protocol is applicable to a wide range of tissue culture cell lines and the culture properties should be adjusted depending on the cell line used. - Let the cells adhere to the culture dish for 4 h, after which treat the cells with 5 µM tamoxifen (4OHT) to induce Cre-activity and SRSF3 depletion (Figure 1–step 2).
Note: We have tested a range of tamoxifen (4OHT) concentrations and 5 µM 4OHT results in high recombination efficiency with minimal cytotoxicity. - After 24 h, collect the cells from the first well as the first-time point by brief trypsination (0.1% trypsin for 3 min at 37 °C) or by using a cell scraper; t = 0 (Figure 1–step 3). A rapid processing of samples is required for the accuracy of the time points.
- Spin down the collected cells at 470 x g for 3 min at 20 °C.
- Re-suspend the cell pellet in 1 ml of TRI Reagent and freeze at -80 °C.
- To the remaining 5 wells, add 30 µl of 1 mg/ml Actinomycin D stock to obtain a final concentration of 10 µg/ml in 3 ml of culture media (Figure 1–step 3).
Note: Make 1 mg/ml Actinomycin D stock in DMSO and freeze in aliquots at -20 °C. Dilute 30 µl of Actinomycin D stock in 100 µl of media and add dropwise to each well for uniform distribution. - Collect samples at 1, 2, 4, 6 and 8 h time points following Actinomycin D addition and freeze the cell pellet in 1 ml of TRI Reagent as described above (Figure 1–steps 4 and 5).
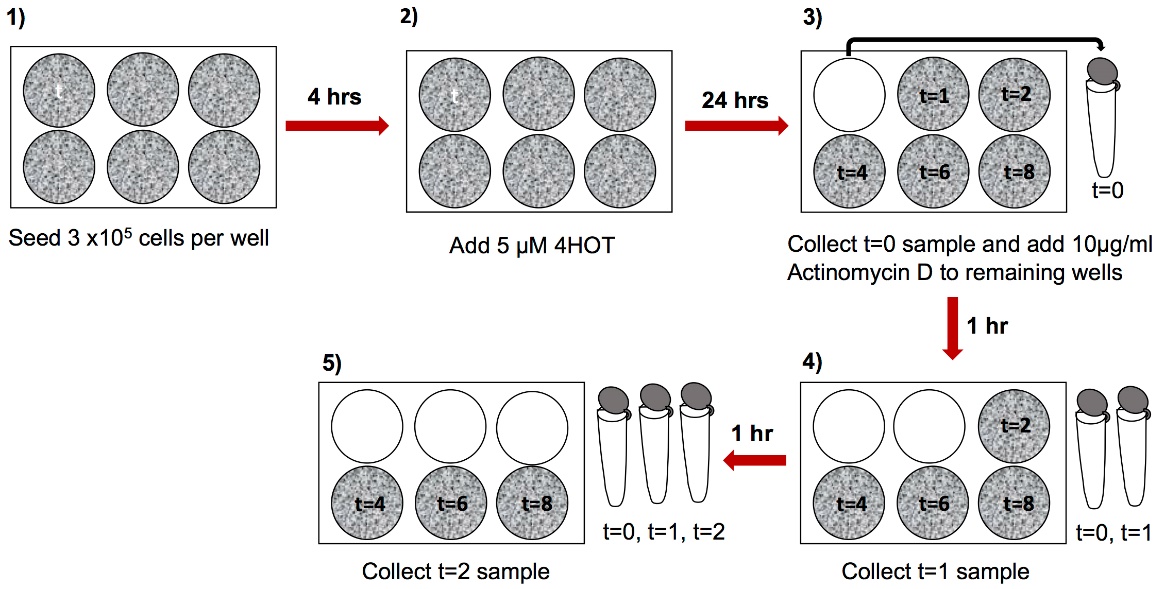
Figure 1. Experimental setup and sample collection. Collect the samples at relevant time points and proceed to RNA extraction.
- Seed 3 x 10⁵ cells per well in 3 ml of media in each well of a 6-well plate (Figure 1–step 1, in total 6 wells per replicate).
- RNA extraction
- Thaw the cells frozen in TRI Reagent at room temperature for 10 min.
- Add 200 µl of chloroform and shake vigorously for 15 s and allow to stand for 10 min at room temperature.
- Centrifuge at 12,000 x g for 15 min at 4 °C.
- Transfer the aqueous layer into a fresh tube and add 500 µl of 2-propanol and 1 µl of Glycogen.
Note: Addition of glycogen helps the maximum recovery of the RNA and visualization of the RNA pellet. - Mix carefully and allow to stand at room temperature for 10 min to precipitate the RNA.
- Centrifuge the mixture at 12,000 x g for 10 min at 4 °C.
- Remove the supernatant and wash the RNA pellet by adding 1 ml of 75% ethanol, vortex and centrifuge at 7,500 x g for 5 min at 4 °C.
- Briefly air-dry the RNA pellet for 5-10 min.
Note: Avoid over-drying the pellet as this will greatly decrease its solubility. - Re-suspend RNA in 30 µl of RNase-free water and proceed to cDNA Synthesis.
- Reverse transcription and quantitative real-time PCR
- Perform DNaseI treatment on all samples to remove potential genomic DNA contamination that can affect the downstream analysis. We used Promega RQ1 DNase kit according to the manufacturer’s protocol and use 1 µg of RNA per sample.
- Carry out the reverse transcription of the RNA samples using a reverse transcription kit. We used SuperScript III Reverse transcriptase according to the manufacture’s protocol with equal amounts of random hexamers and oligodT18 for reverse priming. In short,
1 µgthe same volumn (According to the max concentration, for example 5ul per sample with the highest conc. is 200ng/ul) of DNaseI-treated RNA is incubated with dNTPs and primers at 65 °C for 5 min, followed by the addition of SuperScript III reagents. The cDNA synthesis is performed at 50 °C for 1 h and the reaction terminated by incubation at 70 °C for 15 min.
Note: A mixture of random hexamers and oligodT18 can improve the sensitivity of the cDNA synthesis. - Dilute the cDNA 1:10 with nuclease-free water to be used as a template for quantitative PCR.
- Perform quantitative PCR with the primers specific for the gene of interest. Use the optimized manufacturer’s protocol for specific SYBR Green master mixes. We used 5 µl of Luminaries 2x HiGreen qPCR Master Mix per reaction, optimized concentration of each forward and reverse primers (typically 0.15-0.30 µM end concentration) and 2 µl of diluted cDNA per reaction. Perform two or more technical replicates for each sample.
Data analysis
- Upon the completion of the PCR, run the machine specific software to extract the data. We used SDS software.
Note: The dissociation curve should produce a single peak for each reaction indicating the amplification of a single specific product (Figure 2C). - Export Ct values to Excel spread sheet and calculate the average of replicates for each reaction.
- Normalize the Ct average of each time point to the Ct average value of t = 0 to obtain ∆Ct value.
∆Ct = (Average Ct of each time point – Average Ct of t=0). - Calculate the relative abundance for each time point.
mRNA abundance = 2(-∆CT) - Plot the relative abundance of mRNA at each time point relative to t = 0 using GraphPad Prism or similar software (Figures 2A and 2D).
- Determine the mRNA decay rate by non-linear regression curve fitting (one phase decay) using GraphPad Prism (Figure 2B). We used following parameters:
- Least squares (ordinary fit)
- Confidence level–95%
- Asymmetrical (likelihood) CI
- Goodness of fit was quantified with R square
- Convergence criteria–medium
- This protocol describes one biological replicate but at least three independent experiments should be performed for statistical assessment.
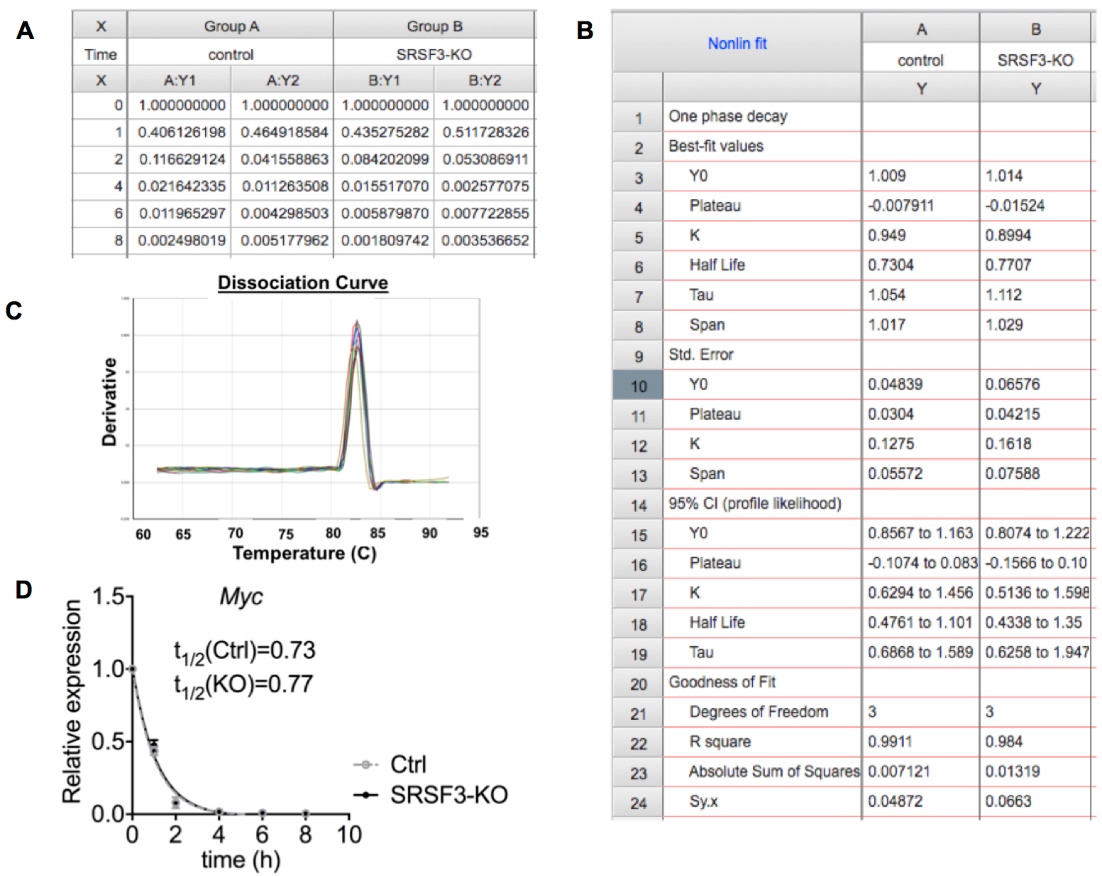
Figure 2. Data analysis. A. Relative Myc mRNA abundance (2(-∆CT)) for each time point for 2 replicates in control and SRSF3 depleted iPS cell samples. B. One phase decay analysis in GraphPad Prism. C. The dissociation curve with a single peak indicating the amplification of a single PCR product. D. Graph representing Myc mRNA decay in control and SRSF3-knockout (KO) cells after Actinomycin D treatment demonstrating similar half-lives for Myc mRNA in control and SRSF3-KO cells.
Recipes
- ES culture media
1x Knock-Out DMEM
15% ESC grade fetal bovine serum
2 mM GlutaMAX
1 mM Non-essential amino acids
1x Penicillin-streptomycin
Add 1,000 U/ml Leukemia Inhibitory Factor (LIF) and 1 µM beta-mercaptoethanol just before use
Acknowledgments
MLA was supported by National Health and Medical Research Council (NHMRC) GNT1043092 and GNT1138870, Aatos and Jane Erkko Foundation and Monash Biomedicine Discovery Fellowship.
Competing interests
The authors have no conflicts of interest or competing interests.
References
- Anko, M. L., Muller-McNicoll, M., Brandl, H., Curk, T., Gorup, C., Henry, I., Ule, J. and Neugebauer, K. M. (2012). The RNA-binding landscapes of two SR proteins reveal unique functions and binding to diverse RNA classes. Genome Biol 13(3): R17.
- Avendano, C. and J. Menéndez (2008). DNA Intercalators and topoisomerase inhibitors. Medicinal Chemistry of Anticancer Drugs. Elsevier Inc.: Madrid, Spain: 199-228.
- Bensaude, O. (2011). Inhibiting eukaryotic transcription: Which compound to choose? How to evaluate its activity? Transcription 2(3): 103-108.
- Berg J. M., Tymoczko J. L. and Stryer L. (2002). Transcription Is Catalyzed by RNA Polymerase. In: Biochemistry. 5th edition. New York: W H Freeman and Company.
- Chen, C. Y., Ezzeddine, N. and Shyu, A. B. (2008). Messenger RNA half-life measurements in mammalian cells. Methods Enzymol 448: 335-357.
- Harrold, S., Genovese, C., Kobrin, B., Morrison, S. L. and Milcarek, C. (1991). A comparison of apparent mRNA half-life using kinetic labeling techniques vs decay following administration of transcriptional inhibitors. Anal Biochem 198(1): 19-29.
- Ratnadiwakara, M., Archer, S. K., Dent, C. I., Ruiz De Los Mozos, I., Beilharz, T. H., Knaupp, A. S., Nefzger, C. M., Polo, J. M. and Anko, M. L. (2018). SRSF3 promotes pluripotency through Nanog mRNA export and coordination of the pluripotency gene expression program. Elife 7: e37419.
- Shyu, A. B., Greenberg, M. E. and Belasco, J. G. (1989). The c-fos transcript is targeted for rapid decay by two distinct mRNA degradation pathways. Genes Dev 3(1): 60-72.
引用: Readers should cite both the Bio-protocol article and the original research article where this protocol was used:
- Ratnadiwakara, M. and Änkö, M. (2018). mRNA Stability Assay Using Transcription Inhibition by Actinomycin D in Mouse Pluripotent Stem Cells. Bio-protocol 8(21): e3072. DOI: 10.21769/BioProtoc.3072 .
- Ratnadiwakara, M., Archer, S. K., Dent, C. I., Ruiz De Los Mozos, I., Beilharz, T. H., Knaupp, A. S., Nefzger, C. M., Polo, J. M. and Anko, M. L. (2018). SRSF3 promotes pluripotency through Nanog mRNA export and coordination of the pluripotency gene expression program. Elife
老师 我的试验结果 前两个小时半衰期会升高是什么原因啊
你好,请问总RNA如何变化?还有有没有同时做其它的基因?没有的话建议做几个其他的。如果持续下降,并且尝试做过其它基因的水平持续下降,不排除你这个RNA就是比较稳定,并且其它一些调控基因的下降进一步促进了稳定性。
但是根据我的经验,更可能是样本或检测问题
老师您好!放线菌素D这个实验我做了好几次了,加药的浓度是2ug/ml,但mRNA相对表达量在1h就降解到一半了,然后我把ActD浓度降低至1ug/ml,还是在1h降至一半,我再次减药后,提出来的RNA浓度变得高高低低,不是呈下降趋势了,但我看文献里很多都是用2、5、10ug/ml这样的浓度,不知道我这个是什么原因,降的实在太快了。
你这个RNA半衰期短,这是正常的,缩短检测的时间间隔就行。你最后结果高高低低是因为药物浓度太低,抑制转录不彻底。
您好,我不同时间点的总RNA测浓度后稀释成等浓度,然后等体积等质量进行逆转录和PCR,最后分析结果这样是可以吗?因为我在干预后每个孔的细胞量肯定是有差异的,所以单纯等体积不能保证RNA的量一样。
首先,你这样做不行。你就按上面说的方法加药和收样。不同时间点样品RNA提取操作保持一致,最后用等体积的RNA反转录就行。你不需要保证反转录RNA的量一样,因为随着加药进行,RNA会降解的,就是要跟0 h去比。
有问题想请教下大家,请问有关放线菌素D的转录抑制效果,师兄等人是如何评估的呢,我们后续实验结果是否也要考虑进去放线菌素D 的转录抑制率?
要考虑药物浓度的,如果药物浓度不能完全抑制,后续降解曲线会高高低低的。测试一下不同浓度的抑制效果,半衰期不再变了,就说明药物浓度够了。
可以出一个中文版的教程吗
你好我想请教下RNase R验证circRNA稳定性有没有实验教程呀?
您好,想请教一下如果要对两种不同处理条件 加ACTD后在不同时间点收样的样品,进行建库测序,需要在建库前添加如ERCC等内参吗?还是说直接按照等体积RNA建库即可?
您好,如果你有内参就最好加进去,减少误差
老师您好,我最近做mRNA稳定性实验出现一个问题,我提取的RNA浓度是呈一个递减的趋势,但是等体积逆转录后qPCR结果上上下下起伏,不知道出现了什么问题
我也是,请问你的问题解决了吗?
我也出现了这个问题,期待王师兄解答一下;
RNA浓度呈现递减的趋势,等体积逆转录后qPCR结果很奇怪,甚至超过0时。所以用软件得不出half life 值
如果按照上述方法加药和收样,你这种结果可能是药物浓度不够。
你好,请问等体积逆转录的话,对每个样本的质量的范围有要求吗?
额,正常逆转录要求的范围内都可以,不要太低了,我一般使用的时候满足>50 ng/ul就可以接受了,浓度太高更容易引入误差
进哥悬浮细胞如THP-1要先诱导贴壁再加ACTD吗
请问悬浮细胞做这个实验在流程上有什么区别吗?
就这个方法而言,我觉得差不多的,没啥区别
网站内容细致又干货满满,您也太优秀了!想请教一下ActD实验结果的统计,也是参考了您的建议不使用内参,直接以等体积RNA逆转录。但是检测基因的RNA似乎很稳定性,对照组到36h左右才能基本达到降解一半,实验组36h能到80%左右降解率。用graphpad非线性回归计算得到的半衰期数值非常大(好几万),您知道是什么原因吗?
额,不好意思,刚刚看到消息,如果36小时才降解一般,那肯定ACTD没能完全抑制转录,需要提高ACTD浓度,一般不建议这个周期超过12小时,RNA半衰期很短
我也出现这种情况,我觉得是因为没有达到半衰期的原因吧,所以计算不出来,这个是不是不用纠结,另一组有半衰期就行,已经说明问题了
我觉得先收集0h的细胞,然后再加ACTD再在不同时间点收集细胞提RNA这个顺序似乎不太对,因为本身细胞也在增殖,这样的话没法保证细胞量一致,应该是在不同的时间点加ACTD,然后最后在统一的时间收集所有样本,这样保证细胞数量一致的情况下,各孔细胞受ACTD处理不同时间。
是的,但是因为处理时间较短,6-8小时,这远低于一个细胞分裂的周期(G1:6-12h,S:0.5-2h),所以影响很小
不同时间点加药一起收也可以
您好,我做的是circRNA,根据参考文献,采取的是0h,6h,12h,18h,24h时间点进行处理,最后统一进行提取总RNA,发现RNA的浓度依次递减,分别是365,236,126,78,41,如果按照楼上的回复,按照同体积进行逆转录,那这样的话表达量不是肯定是递减的吗?
您好 表达量本来就肯定是递减的 毋庸置疑,现在关键得到半衰期
如果等质量,相当于吧ACTD导致的转录抑制给抵消了
您好,我最近也在做这个实验,请问可以加个联系方式交流一下吗?我的微信是TO56706599
不同加药时间似乎不对。初始细胞数量保证一样,一起加入放线菌素D后抑制转录,此时mRNA水平近似一样,正常情况下随时间线性降解,计算半衰期判断稳定性变化。你要是不同时间点加药,那从种细胞,到加药时间不同,不同组的细胞量不同,抑制转录时mRNA水平不同。我感觉比较好的办法,是提RNA前细胞计数。不同时间点细胞计数一样,可判断半衰期
想问一下关于半衰期的计算是用什么软件
graphpad spss 各种统计软件都可以 这里面教程使用的graphpad,非线性回归
师兄,我也想加你微信,你会好多,想和你们多多学习讨论
当然 导航栏我的简历里面有微信
你好,老师。我想问下跑qPCR验证circRNA稳定性,怎么设计和circRNA对应线性转录本的引物?
我目前只有circRNA的序列
明白了 已经解决了吗 还没有的话加微信再讨论吧
我也是遇到这个问题,我用放线菌素处理细胞以后验证circRNA稳定性,0 2 4 6 8 10 12这几个时间来收样,结果出来的曲线circRNA也被消化掉了,mRNA反而曲线上升趋势,我考虑了内参GAPDH会被消化,因此选了U6做内参,一样的效果也不满意。另外放线菌素你们是DMSO稀释以后使用是吗?
您好,其实嘛,ACTD是一种广谱RNA转录抑制剂,不管是GAPDH还是U6,都会被转录抑制。你也会发现提取的总RNA也存在ACTD处理时间依赖性降低,So,从我的理解和经验,不合适选取内参,逆转录时也不宜按照同样RNA量进行逆转录,试想一下,按照相同RNA量会拉平实际降解趋势。
ACTD 当然可以用DMSO溶解,保证低于DMSO毒性剂量就行
非常感谢!
好嘞,谢谢哈
请问您后续的实验是怎么处理的呢?我跟您的实验趋势一模一样,一直都做不出来
你好,我想问下怎么设计跑qPCR用的circRNA对应线性转录本的引物啊?
没太明白意思 你是用于什么实验?
就circRNA的母基因设计线性引物就可以了
您好,例如hsa_circ_0021592来源于hipk3基因,其序列是hipk3 Transcript Variant 1 mRNA的一部分。那我设计跑Q 用的 hsa_circ_0021592对应线性mRNA引物是用整个 Transcript Variant 1 mRNA序列,还是用Transcript Variant 1 mRNA中与hsa_circ_0021592序列相同的那部分序列?
我用的整个mRNA
有可能你circRNA的引物特异性不够好,而且等体积逆转录一般mRNA也是下降的啊
老师您好,想咨询个试验问题,不知道能否帮忙解答一下,谢谢。
我在加入10ug/ml 放线菌素D后,分别在0、4、8、12 h ,4个时间点收细胞提取RNA,但最终定量PCR发现 目的RNA不但没有随着 时间延长而减少,反而随着时间延长表达增高,请问这有可能是什么原因呢?
期待您的解答,
谢谢
您好,不清楚你的具体实验操作和结果,正常情况下,处理12h,RNA大多已经下降到较低水平,一般实验也不用那么长,现在的情况是上升了,这样看也不知道什么原因
方便的话加微信 你先发我 我晚一点给你看看
您好,我也遇到了同样的问题,请问您的问题解决了吗?
要不加我微信,我们仨一起讨论一下
您好,我也遇到了同样的问题,请问怎么加您微信
18021308280
你好,请问这个问题解决了吗,我也遇到了同样的问题
加微信吧 拉你们进一个群 之前有讨论过
问题解决了吗?我加了放线菌素D后,降解曲线高高低低成波浪形,已经断断续续做了大半年,用完了两管了,不知道问题出在了哪里,快崩溃了!!!!
我的问题已经在老师指导下解决了,但不知道是不是跟你遇到的是同一个问题。
我的问题是:忽略了ActD不仅会抑制目的mRNA的转录,会抑制所有mRNA转录,包括内参,所以在计算结果时候就不能按平时的方法来计算相对表达量。
我的方法是:细胞在铺板时候要保证每孔细胞量一致,然后加10ug/ml ActD,然后在不同时间段收细胞提RNA,但尽量要在细胞倍增时间之前结束最后一个时间点,保证每个时间点收细胞时细胞量一致,提取RNA后等体积逆转录,而不是等质量逆转录,因为收细胞时细胞量是一定的,所以如果不加ActD,理论上提取出来RNA也是一样的,加了ActD,随着mRNA降解,剩下的也就不同了,这样等体积逆转录才能反映ActD抑制转录后 mRNA剩余的量。不知道有没有表达清楚?。
计算方法就按照老师上面写的方法计算就好了,以(0)h 的为基准,ave(x)h CT值- ave(0)h CT值,得到 ΔCT,然后再算2(-ΔCT1)次幂,就可以出图了。
棒???
请问您的意思就是不需要内参进行相对定量了是吗? 只要保证铺的细胞量一定且在倍增前收样,就只需要测目标基因的CT值计算?
另外还有一个问题想问老师,是否可以在不同时间段加药后,同时收样;而不像您图示的每个时间点分开收样。应该是一样的吧?
是的,没法使用内参,内参转录也被抑制。保证每个时间点种板细胞量一样,当然最好加药时间低于倍增时间,我使用的时间点是0-5h, 其实实际上ACTD处理之后细胞周期相关基因表达同样被抑制,细胞增殖分裂也被抑制了,不同时间点细胞量的差异其实不大。关于计算,按照说明操作即可
此外,根据经验,逆转录时要保证体积一样 而非RNA量,因为不同时间点的total RNA会时间依赖性降低,如果按照同样RNA量逆转录将会拉平降解曲线
当然可以不同时间点加药,我实际上也是这样操作,一起收样方便
你好,我想问一下你在不同时间段加药是怎么操作的呢?因为一开始要铺定量的细胞/孔,如果分不同时间段加药的话,细胞也要不同时间段铺到孔里这样好像也挺麻烦而且要准备很多皿细胞来铺板
你指的药是你的处理药物 还是指的ACTD,如果是药物,处理时间一般比较长,处理好之后重新种板再做稳定性实验;如果指的ACTD,因为一般收样时间在6-8小时之内,细胞同时种进去,不同时间加药,这个时间差影响不大。
也许我理解错你的意思了,还有问题加微信吧,我们有个讨论这个的群 也是之前留言讨论的
学到了学到了
你好,请问可以加微信吗?
加我微信 网站导航栏我的简历有,拉你进这个实验讨论群
这是什么神仙操作,一样的细胞量提取RNA我也不一定能提到相同的RNA量,各个步骤到后面,感觉太难稳定出结果
建议用传统trizol法提取RNA,方法稳定,得率也稳定;用试剂盒抽提没法保证,毕竟这个市场有点鱼龙混杂
同样的问题,我做了十来次,降解曲线一点也不好看
请问您的问题解决了吗?真心求教,最近实验也做不好,欲哭无泪
加微信吧 之前有讨论过
我也是这个问题,求解决
加我微信 拉你进群讨论
Hey there! Would you mind if I share your blog with my facebook group?
There’s a lot of folks that I think would really enjoy your content.
Please let me know. Cheers
Sure, it’s my honor
Excellent, what a blog it is! This weblog provides useful facts to us,
keep it up.
Thank you for your affirmation. I will keep it up.
Very good blog! Do you have any suggestions gym wear for men
aspiring writers? I’m hoping to start my own website soon but I’m a little lost on everything.
Would you recommend starting with a free platform like WordPress or go for a paid
option? There are so many choices out there that I’m completely overwhelmed ..
Any tips? Bless you!
Thank you!
I suggest starting from a free platform, such as WordPress, which has many templates and plug-ins that can be used directly, so that it can easily adapt to all aspects of your needs.