Introduction
指数衰减方程模拟了许多化学和生物过程。每当某件事发生的速率与剩余的量成比例时,就会使用它。以下是三个示例:
•当配体与受体解离时,在任何短时间间隔内解离的分子数量与该间隔开始时结合的分子数量成比例。等效地,与受体结合的每个配体分子在任何小的时间间隔内都有一定的概率与受体解离。这种可能性不会随着配体在受体上停留的时间越长而变得越高。
•当放射性同位素衰变时,在任何短间隔内衰变的原子数量与间隔开始时存在的未衰变原子数量成比例。这意味着每个单独的原子都有一定的概率在小的时间间隔内衰变,而且这种概率是恒定的。任何特定原子衰变的概率都不会随着时间的推移而改变。样品的总衰变随着时间的推移而减少,因为未衰变的原子越来越少。
•当药物通过肝脏代谢或通过肾脏排泄时,代谢或排泄的速率通常与血浆中药物的浓度成比例。每个药物分子都有一定的概率在短时间内被代谢或分泌。随着药物浓度的下降,其代谢或排泄率也会下降。
An exponential decay equation models many chemical and biological processes. It is used whenever the rate at which something happens is proportional to the amount which is left. Here are three examples:
•When ligands dissociate from receptors, the number of molecules that dissociate in any short time interval is proportional to the number that were bound at the beginning of that interval. Equivalently, each individual molecule of ligand bound to a receptor has a certain probability of dissociating from the receptor in any small time interval. That probability does not get higher as the ligand stays on the receptor longer.
•When radioactive isotopes decay, the number of atoms that decay in any short interval is proportional to the number of undecayed atoms that were present at the beginning of the interval. This means that each individual atom has a certain probability of decaying in a small time interval, and that probability is constant. The probability that any particular atom will decay does not change over time. The total decay of the sample decreases with time because there are fewer and fewer undecayed atoms.
•When drugs are metabolized by the liver or excreted by the kidney, the rate of metabolism or excretion is often proportional to the concentration of drug in the blood plasma. Each drug molecule has a certain probability of being metabolized or secreted in a small time interval. As the drug concentration goes down, the rate of its metabolism or excretion goes down as well.
Graphpad:
Entering data
Create an XY data table.
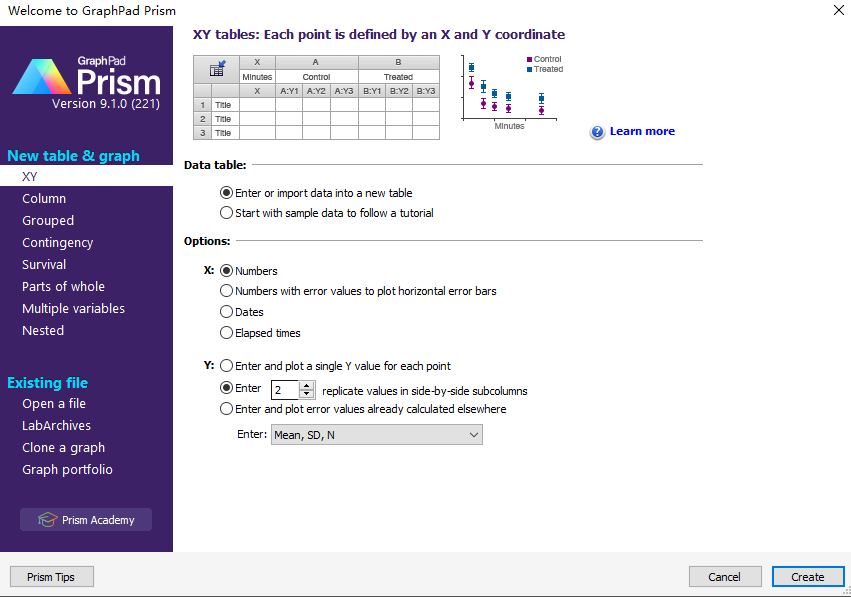
Enter time into X, and response (binding, concentration ..) into Y. If you have several experimentalconditions, place the first into column A, the second into column B, etc.
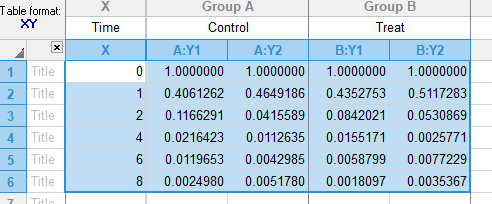
示例数据来源:
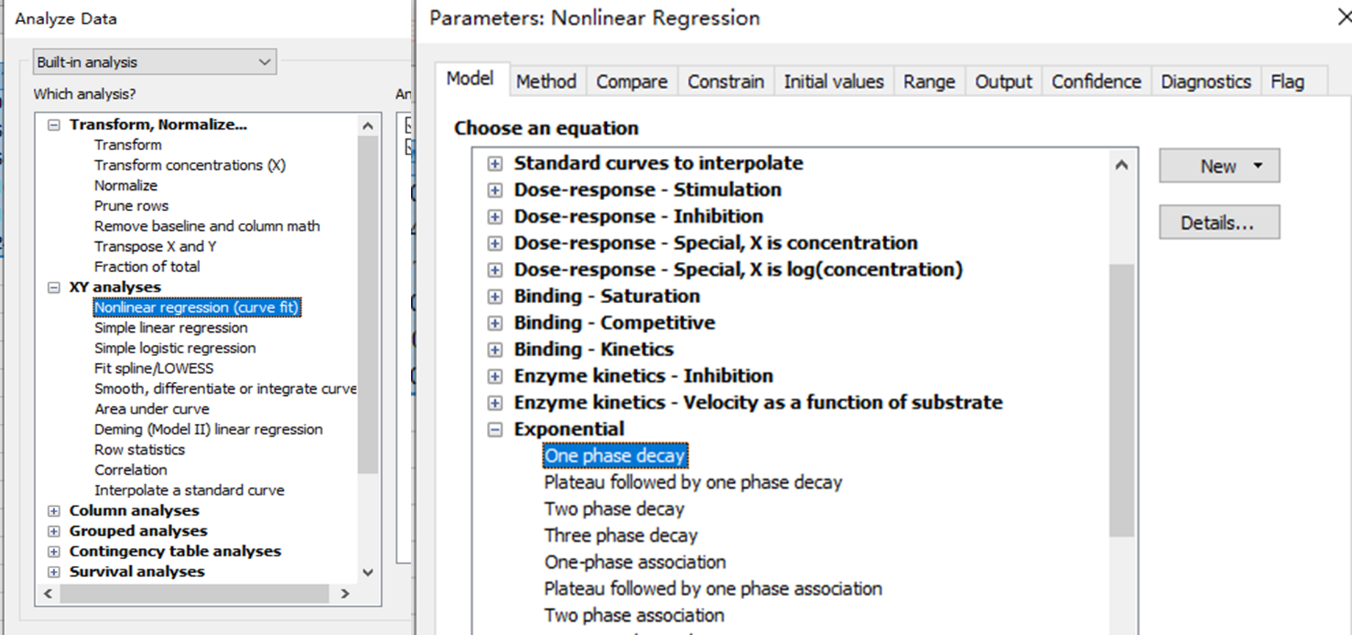
After entering data, click Analyze, choose nonlinear regression, choose the panel of exponential equations, and choose One phase decay.
Consider constraining Plateau to a constant value of zero
If you have subtracted off any background signal, then you know the curve has to plateau at Y=0. In this case, you should constrain the parameter Plateau to be a constant value equal to zero. To do this, go to the Constrain tab of the nonlinear regression dialog, set the drop down next to Plateau to “Constant equal to” and enter the value 0.0.
Results:
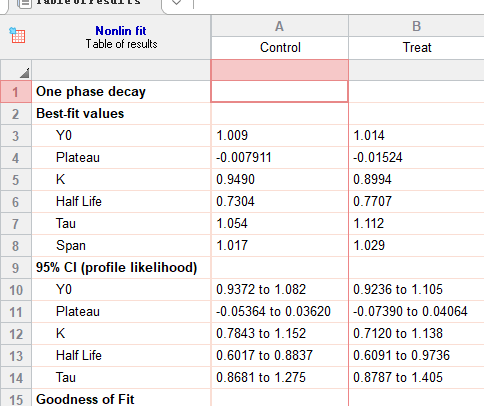
Model : Y=(Y0 – Plateau)*exp(-K*X) + Plateau
Y0 is the Y value when X (time) is zero. It is expressed in the same units as Y,
Plateau is the Y value at infinite times, expressed in the same units as Y.
K is the rate constant, expressed in reciprocal of the X axis time units. If X is in minutes, then K is expressed in inverse minutes.
Tau is the time constant, expressed in the same units as the X axis. It is computed as the reciprocal of K.
Half-life is in the time units of the X axis. It is computed as ln(2)/K.
Span is the difference between Y0 and Plateau, expressed in the same units as your Y values.
R语言解决方案:
dfs <- df %>% plotly::filter(Group== “Group”)
fit <- nls(data=dfs, formula = Response ~ (yhi-ylo)*exp(-1*k*Time) + ylo, start = list(k=1,ylo = 0,yhi = 1))
fit
# Nonlinear regression model
# model: Response ~ (yhi - ylo) * exp(-1 * k * Time) + ylo
# data: dfs
# k      ylo      yhi
# 0.9490  -0.7911 100.9459
# residual sum-of-squares: 188.8
#
# Number of iterations to convergence: 5
# Achieved convergence tolerance: 8.717e-06.8

halftime <- log(2)/0.9490
绘图使用ggplot2,不多赘述!
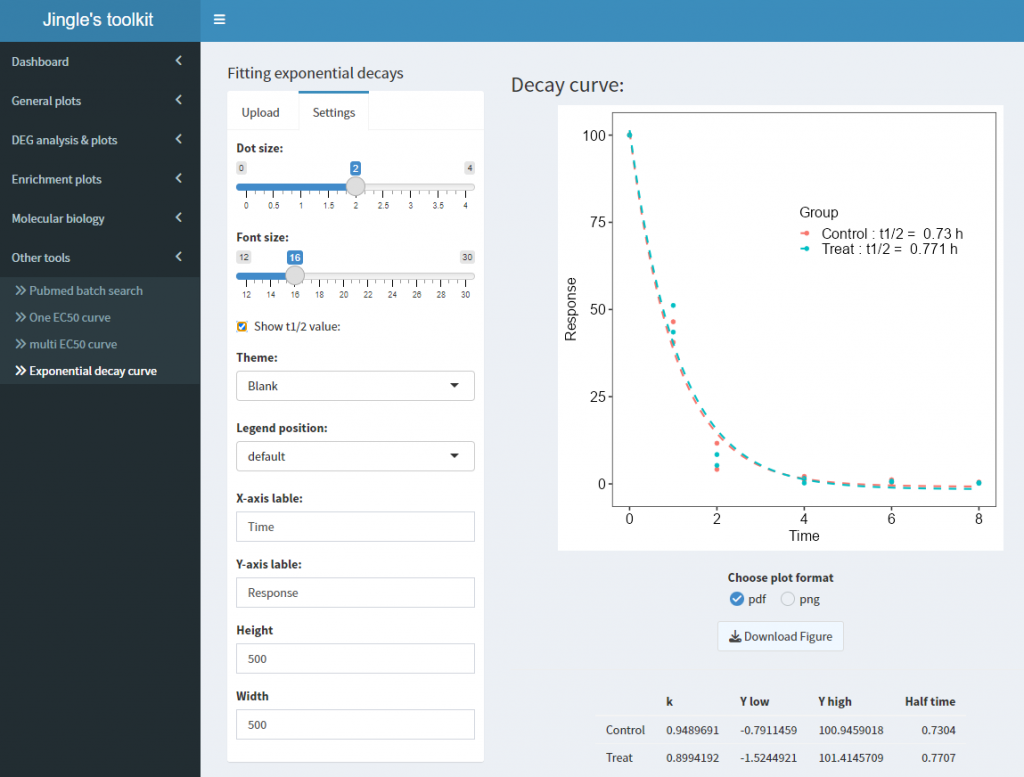
分享给大家进哥做的shiny小程序,整合在toolkit中:
在Other tools中:运行结果如下,与Graphpad一致:
王老师,您好,想请教下您,如果计算蛋白质的半衰期是不是也可以用上述方法呢?