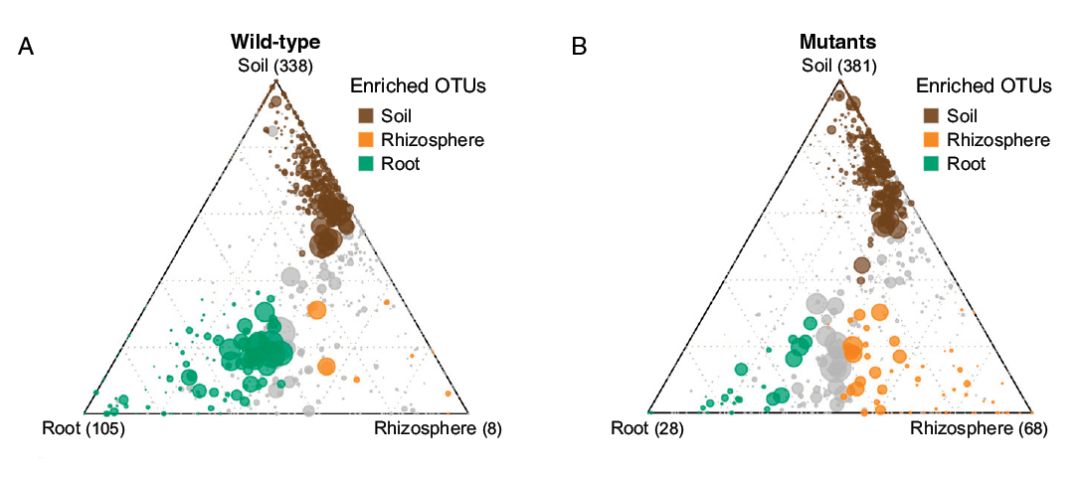
(PNAS,2016)
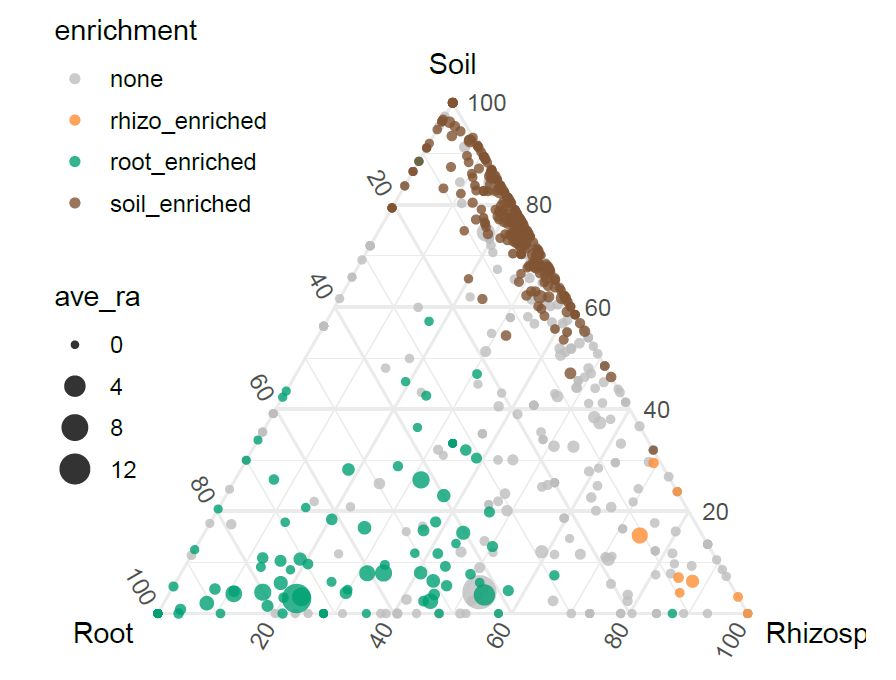
原始数据来源于16年的这篇PNAS文章,这里用Excel计算得到“组内”(下表的2~4列)和“组间”(下表第5列)的平均相对丰度,前者决定三元图气泡的位置,后置决定气泡的大小,不同颜色的气泡表示富集到不同组的OTUs。
感兴趣的同学可以通过文献给出的链接下载原始数据。

#安装ggtern包
install.packages("ggtern")
#加载ggtern包
library("ggtern")
#读入数据,存到data变量中
data<-read.table("result.xls",header = T,sep ="t",row.names =1)
#查看数据框data的前6行
head(data)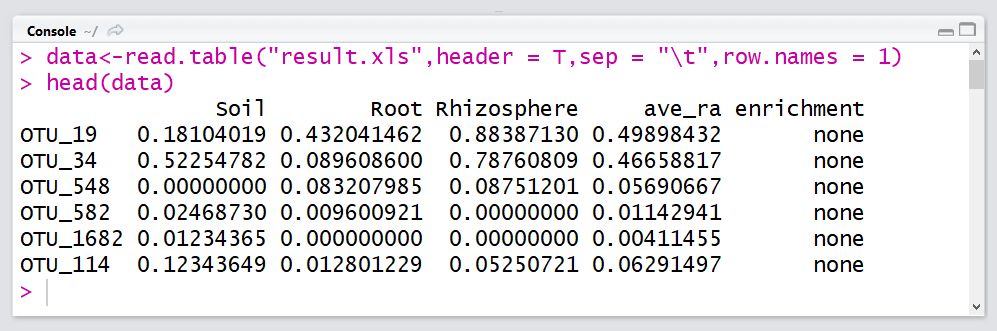
#建立数据的映射关系,绘制三元图
p1<-ggtern(data=data,aes(x=Root,y=Soil,z=Rhizosphere))+

  geom_point(aes(size=ave_ra,color=enriched),alpha=0.8)

p1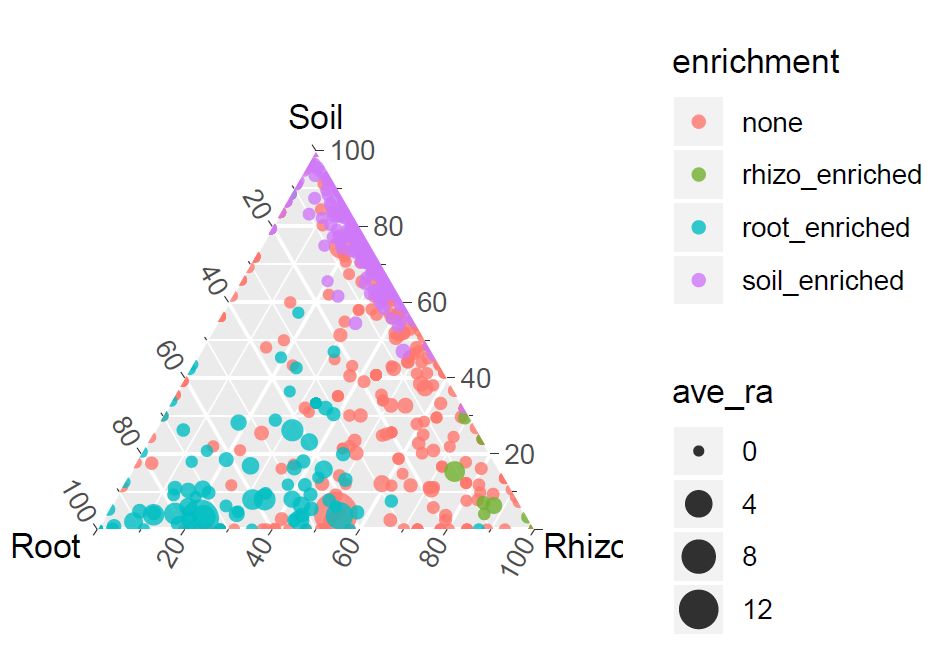
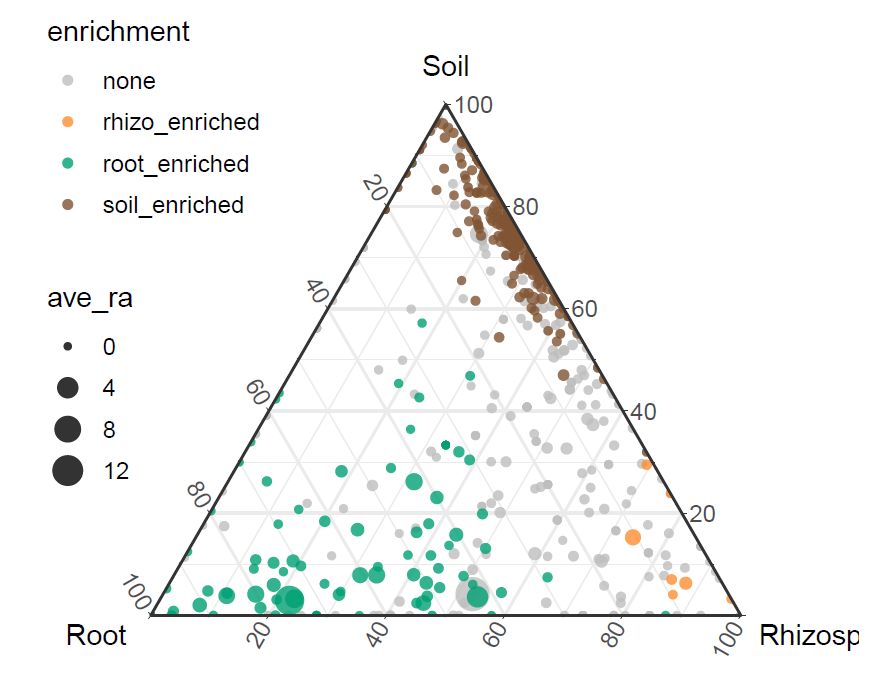
#手动设置点的颜色,“土壤”褐色,“根际”橙色,“根”绿色,未能显著富集到的为灰色
p2<-p1+scale_colour_manual(values = c("grey","#f68b23","#00a070","#7e532f"))

p2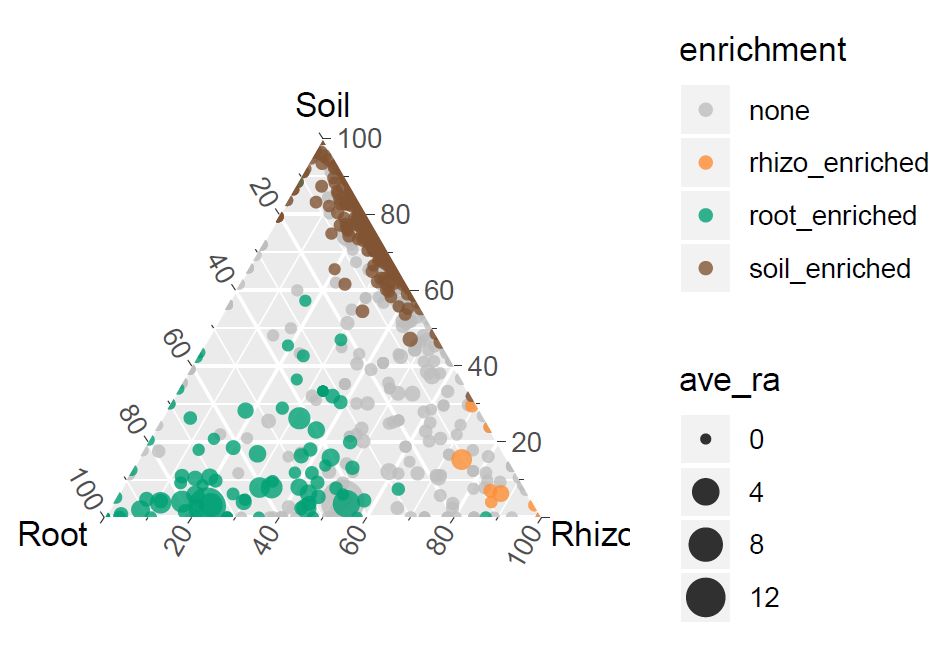
#尝试不同的主题,改变图例的位置
p3<-p2+theme_minimal()+

  theme_legend_position(x="topleft")

p3
p4<-p2+theme_bw()+

  theme_legend_position(x="tl")

p4
p5<-p2+theme_void()+theme(legend.position=c(0,1),

                          legend.justification=c(0,1))

p5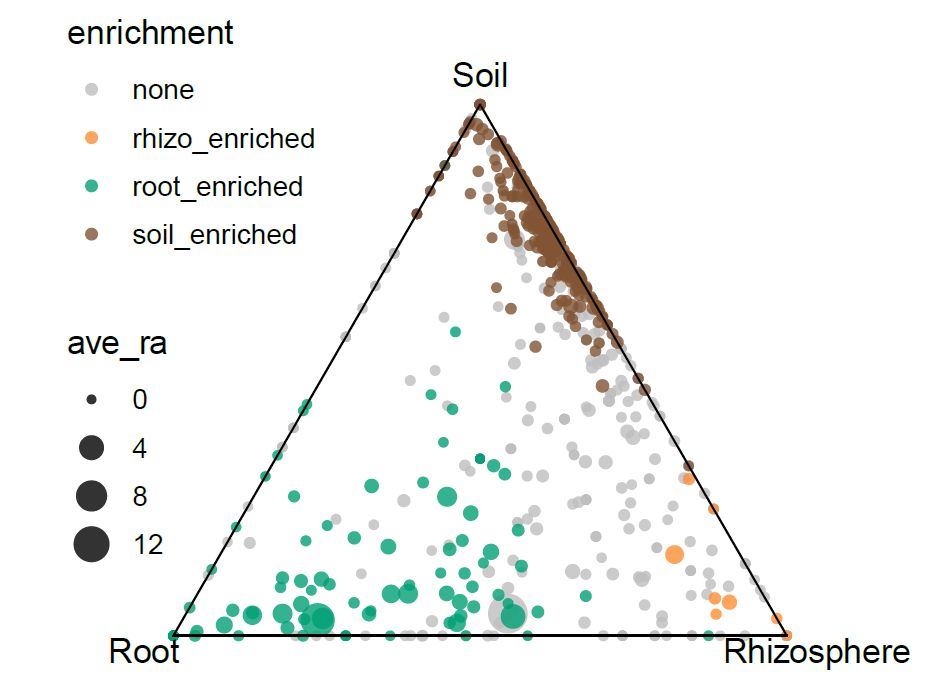
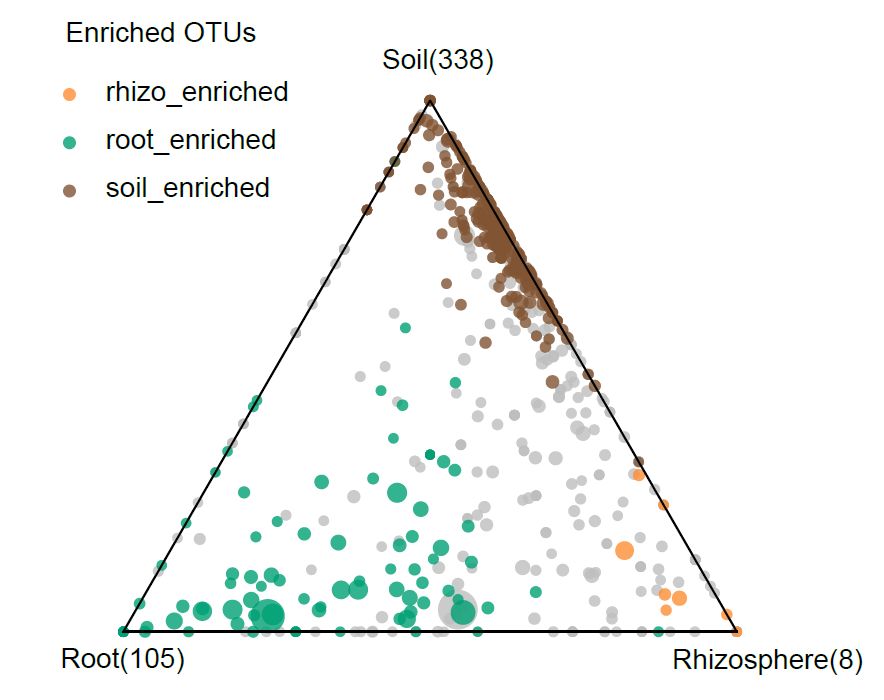
#保存图表为pdf格式
ggsave("p5.pdf",width =4.4,height =4,units ="in")
图片导出为PDF格式后仍需要用Acrobat或Ai做些调整,最终的效果如下:
参考文献
Zgadzaj R,Garrido-Oter R, Jensen D B, et al. Root nodule symbiosis in Lotus japonicusdrives the establishment of distinctive rhizosphere, root, and nodule bacterialcommunities[J]. Proceedings of the National Academy of Sciences, 2016, 113(49):E7996-E8005.
Hamilton NE andFerry M (2018). “ggtern: Ternary Diagrams Using ggplot2.” Journal ofStatistical Software, Code Snippets, 87(3), pp. 1-17. doi:10.18637/jss.v087.c03
您好,请问如果数据太集中,如何将三元图进行放大,即坐标轴不为0-100,感谢。
您好,参考包的说明文档,使用tern_limits函数:https://www.rdocumentation.org/packages/ggtern/versions/2.2.0/topics/tern_limits
感谢,已解决
您好,我没有找到原始数据。请问能否共享一下,我想学习跑一遍。谢谢
您好,数据已添加到文中,请自行下载