加载包载入数据
GEO数据库下载GSE112996_merged_fpkm_table.txt.gz
GSE112996_series_matrix.txt.gz,这两个文件,对
GSE112996_series_matrix.txt.gz进行解压,把这两个文件放到Rproject创建的文件夹。
rm(list=ls())
a <- read.table('GSE112996_merged_fpkm_table.txt.gz',
                header = T,
                row.names=1)
raw_data<- a[,-1]
###表型信息提取
pheno <- read.csv(file = 'GSE112996_series_matrix.txt')
pheno <- data.frame(num1 = strsplit(as.character(pheno[42,]),split='\t')[[1]][-1],
                    num2 = gsub('patient: No.','P',strsplit(as.character(pheno[51,]),split='\t')[[1]][-1]))

{
####数据过滤
data<- a[!apply(raw_data,1,sum)==0,]
####去除重复基因名的行,归一化
data$median=apply(data[,-1],1,median)
data=data[order(data$GeneName,data$median,decreasing = T),]
data=data[!duplicated(data$GeneName),]
rownames(data)=data$GeneName
uni_matrix <- data[,grep('\\d+',colnames(data))]
uni_matrix <- log2(uni_matrix+1)
colnames(uni_matrix)<- gsub('X','',gsub('\\.','\\-',colnames(uni_matrix)))
uni_matrix<- uni_matrix[,order(colnames(uni_matrix))]
}
save(uni_matrix,pheno,file = 'uni_matrix.Rdata')
上述代码为获取测试数据,如果下载其他GEO数据可以参考包
rm(list=ls())
##加载包
{
library(genefilter)
library(GSVA)
library(Biobase)
library(stringr)
}
##载入测试数据
load('uni_matrix.Rdata')
2读取基因列表,得到免疫细胞对应的特异的基因
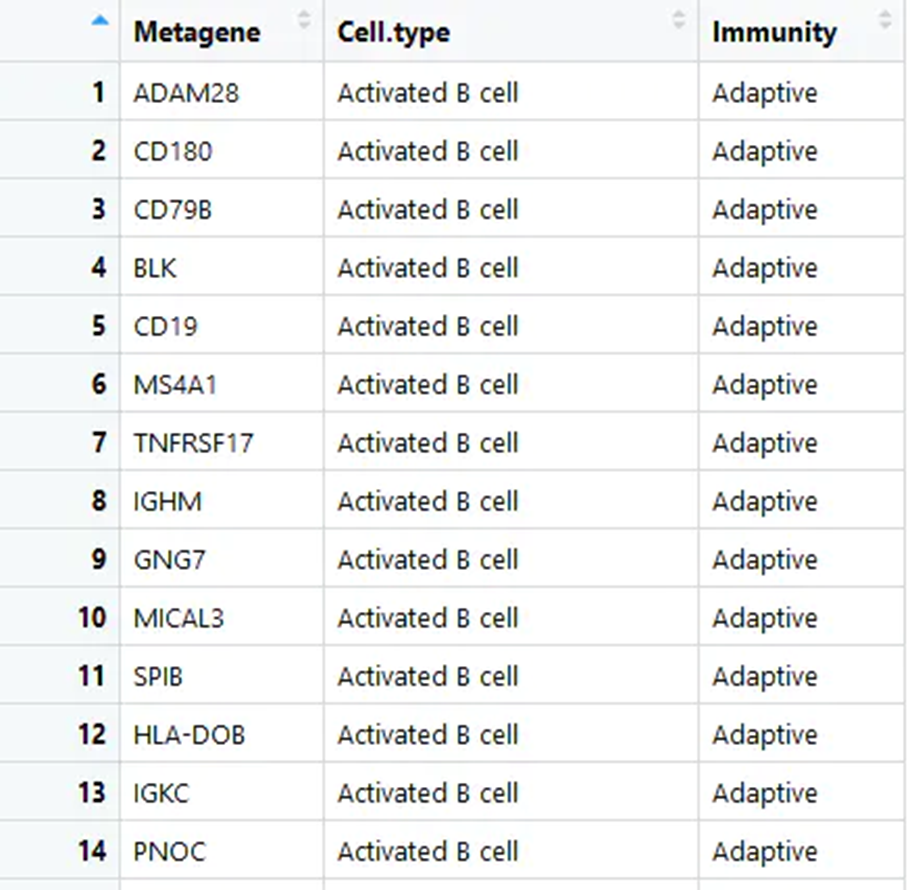
gene_set<- read.csv('mmc3.csv',header = T)##读取已经下载好的免疫细胞和对应基因列表,来源见文献附件
gene_set<-gene_set[, 1:2]#选取特异基因和对应的免疫细胞两行
head(gene_set)获取免疫细胞的metagenes基因集 mmc3.xlsx 删除前两行,保存为mmc3.csv
list<- split(as.matrix(gene_set)[,1], gene_set[,2])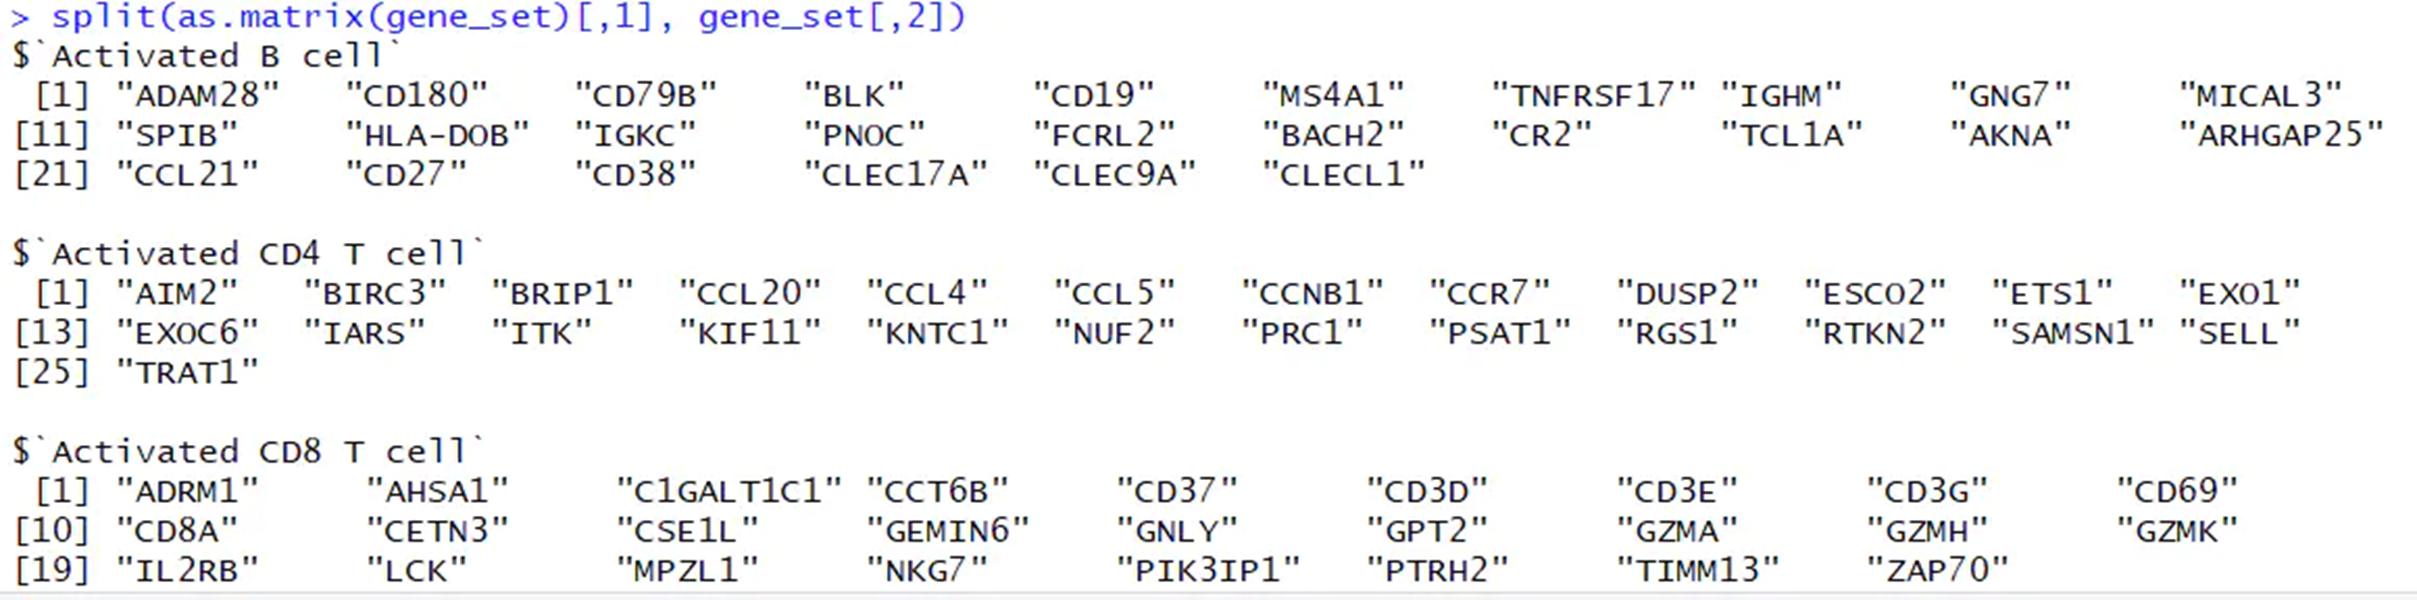
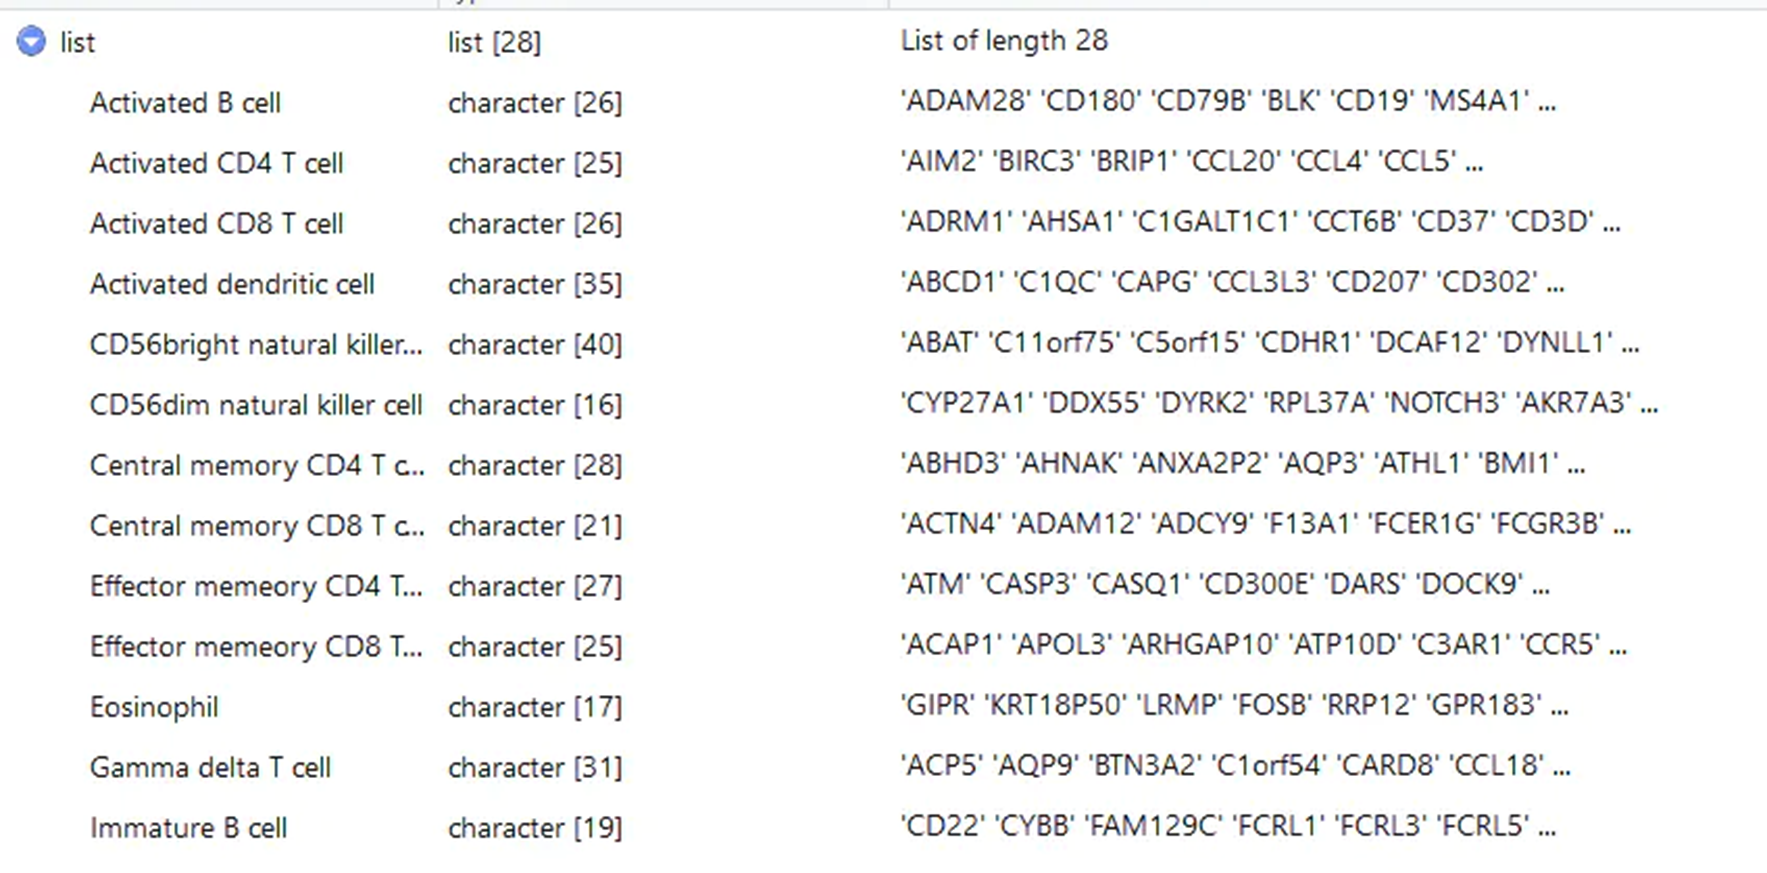
得到每种免疫细胞对应的基因
3评估Estimates GSVA enrichment scores.
gsva_matrix<- gsva(as.matrix(uni_matrix), list,method='ssgsea',kcdf='Gaussian',abs.ranking=TRUE)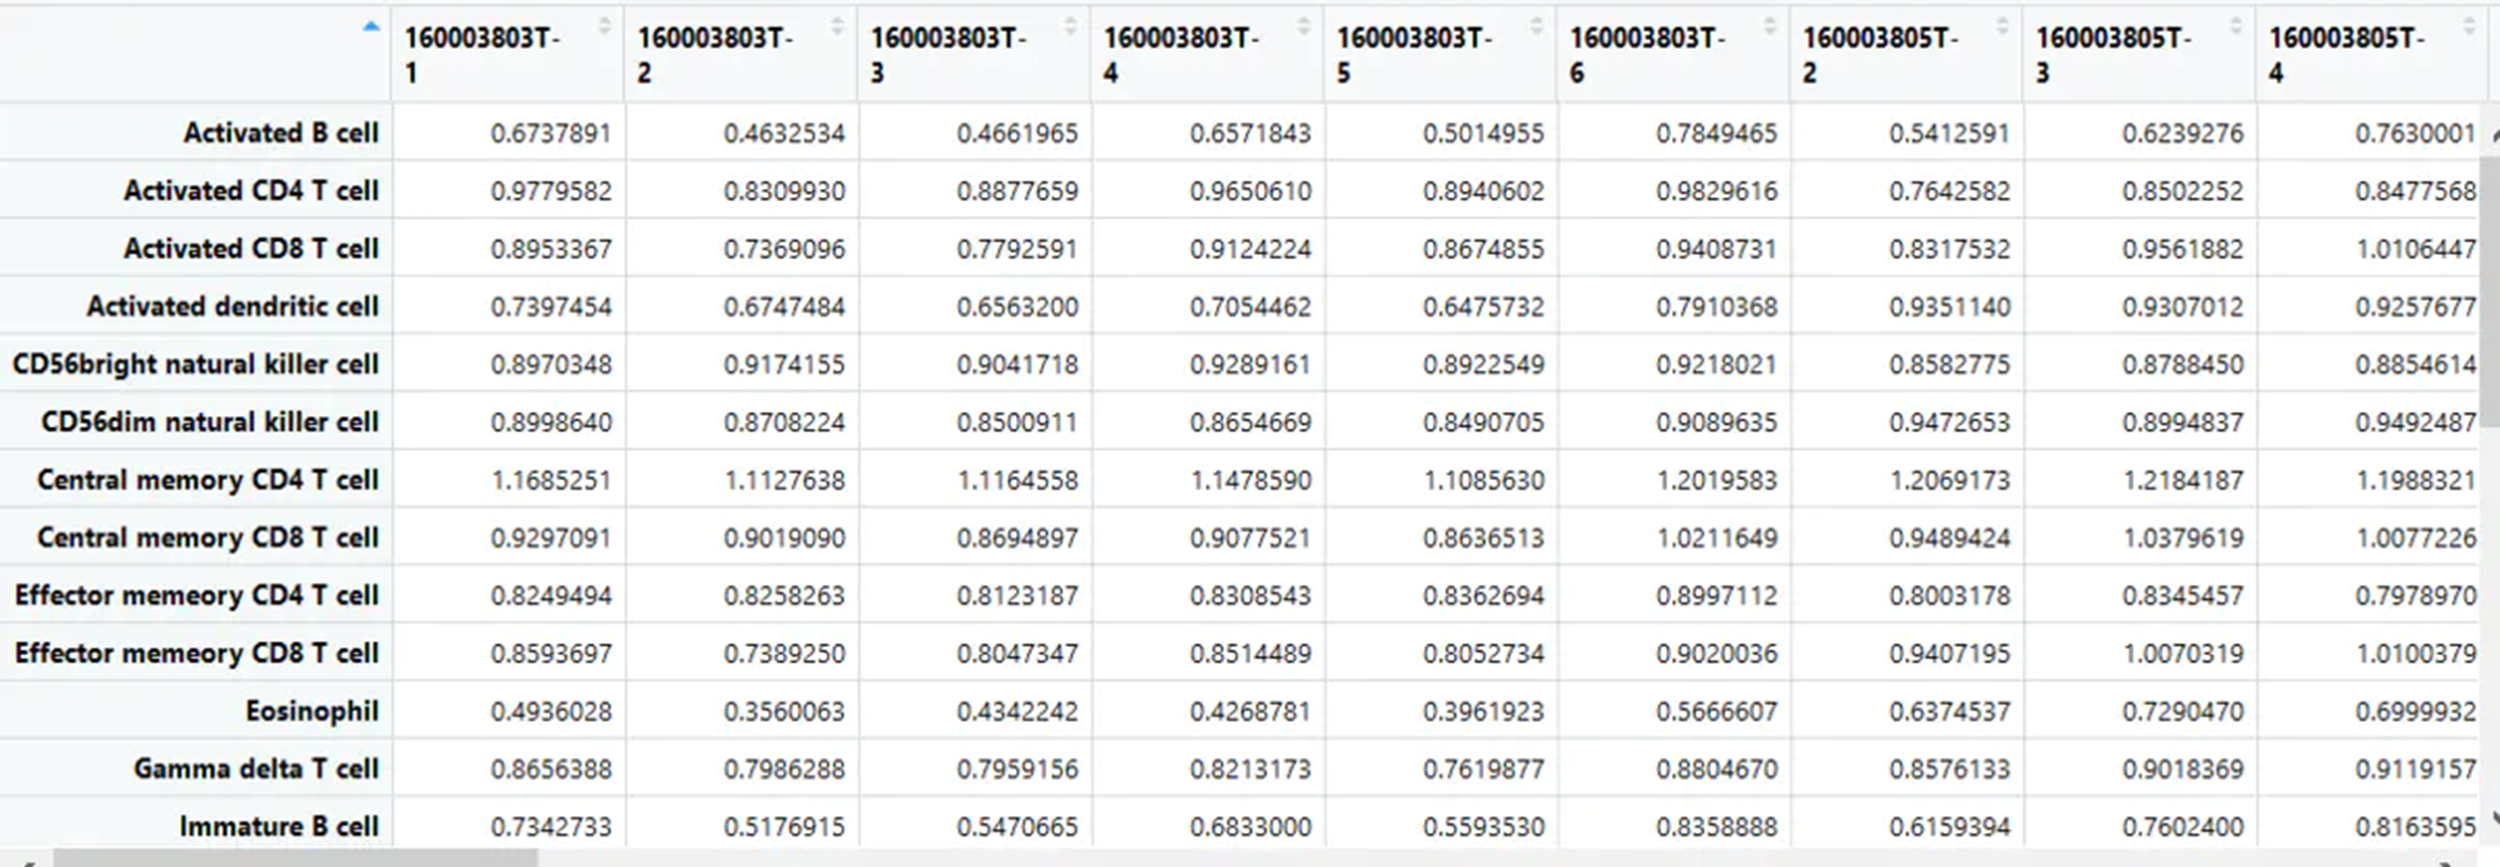
得到对应的富集分数
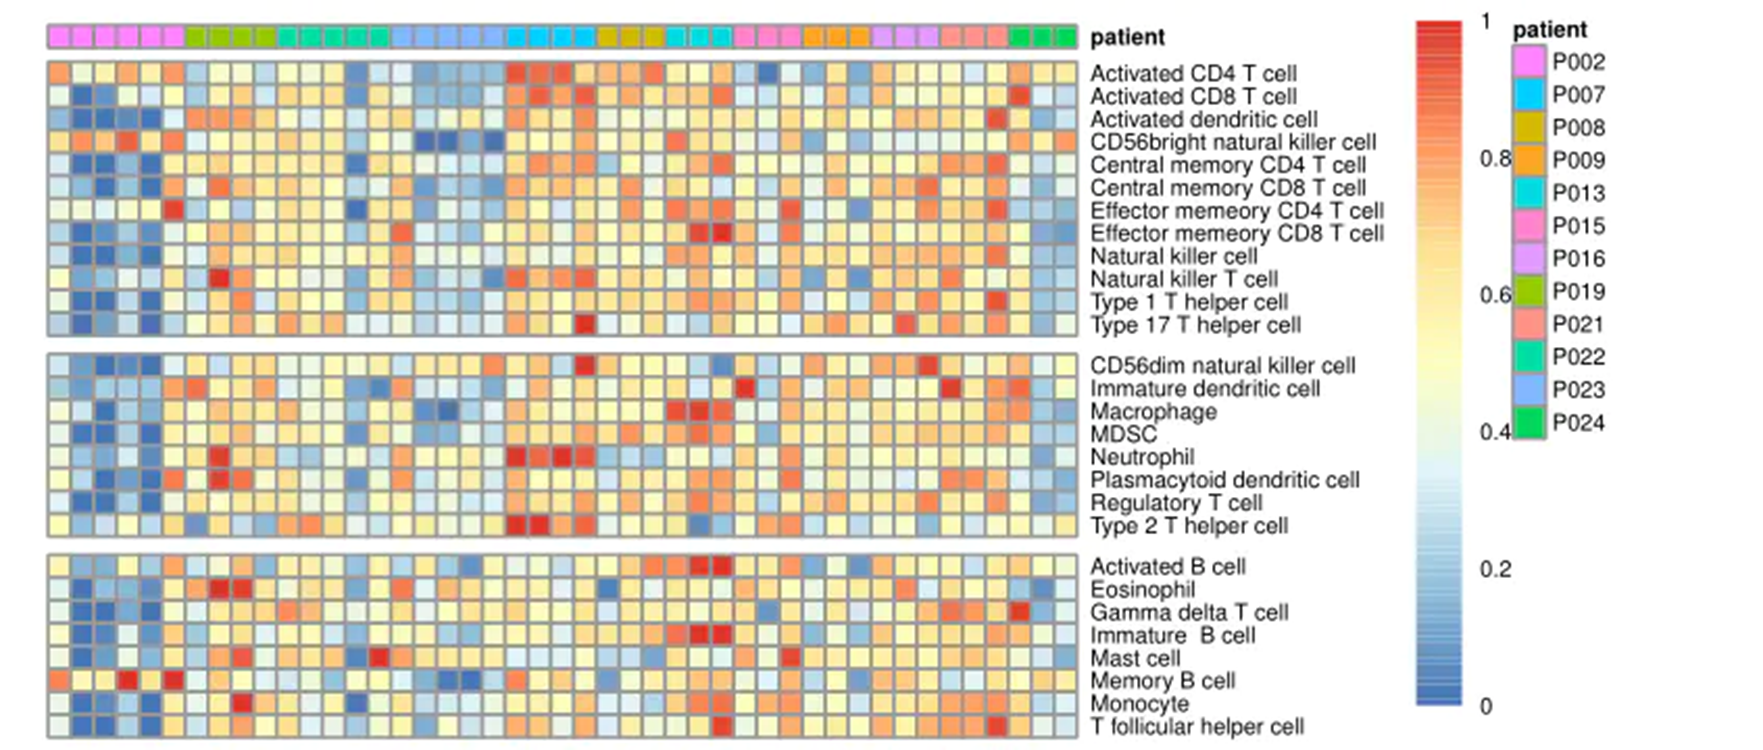
4把富集分数画热图
library(pheatmap)
gsva_matrix1<- t(scale(t(gsva_matrix)))#归一化
gsva_matrix1[gsva_matrix1< -2] <- -2
gsva_matrix1[gsva_matrix1>2] <- 2
anti_tumor <- c('Activated CD4 T cell', 'Activated CD8 T cell', 'Central memory CD4 T cell', 'Central memory CD8 T cell', 'Effector memeory CD4 T cell', 'Effector memeory CD8 T cell', 'Type 1 T helper cell', 'Type 17 T helper cell', 'Activated dendritic cell', 'CD56bright natural killer cell', 'Natural killer cell', 'Natural killer T cell')
pro_tumor <- c('Regulatory T cell', 'Type 2 T helper cell', 'CD56dim natural killer cell', 'Immature dendritic cell', 'Macrophage', 'MDSC', 'Neutrophil', 'Plasmacytoid dendritic cell')
anti<- gsub('^ ','',rownames(gsva_matrix1))%in%anti_tumor
pro<- gsub('^ ','',rownames(gsva_matrix1))%in%pro_tumor
non <- !(anti|pro)##设定三种基因
gsva_matrix1<- rbind(gsva_matrix1[anti,],gsva_matrix1[pro,],gsva_matrix1[non,])#再结合起来,使图分成三段
normalization<-function(x){
return((x-min(x))/(max(x)-min(x)))}#设定normalization函数
nor_gsva_matrix1 <- normalization(gsva_matrix1)
annotation_col = data.frame(patient=pheno$num2)#加上病人编号
rownames(annotation_col)<-colnames(uni_matrix)#使编号能互相对应
bk = unique(c(seq(0,1, length=100)))#设定热图参数
pheatmap(nor_gsva_matrix1,
show_colnames = F,
cluster_rows = F,cluster_cols = F,
annotation_col = annotation_col,
breaks=bk,cellwidth=5,cellheight=5,
fontsize=5,gaps_row = c(12,20),
filename = 'ssgsea.pdf',width = 8)#画热图
save(gsva_matrix,gsva_matrix1,pheno,file = 'score.Rdata')
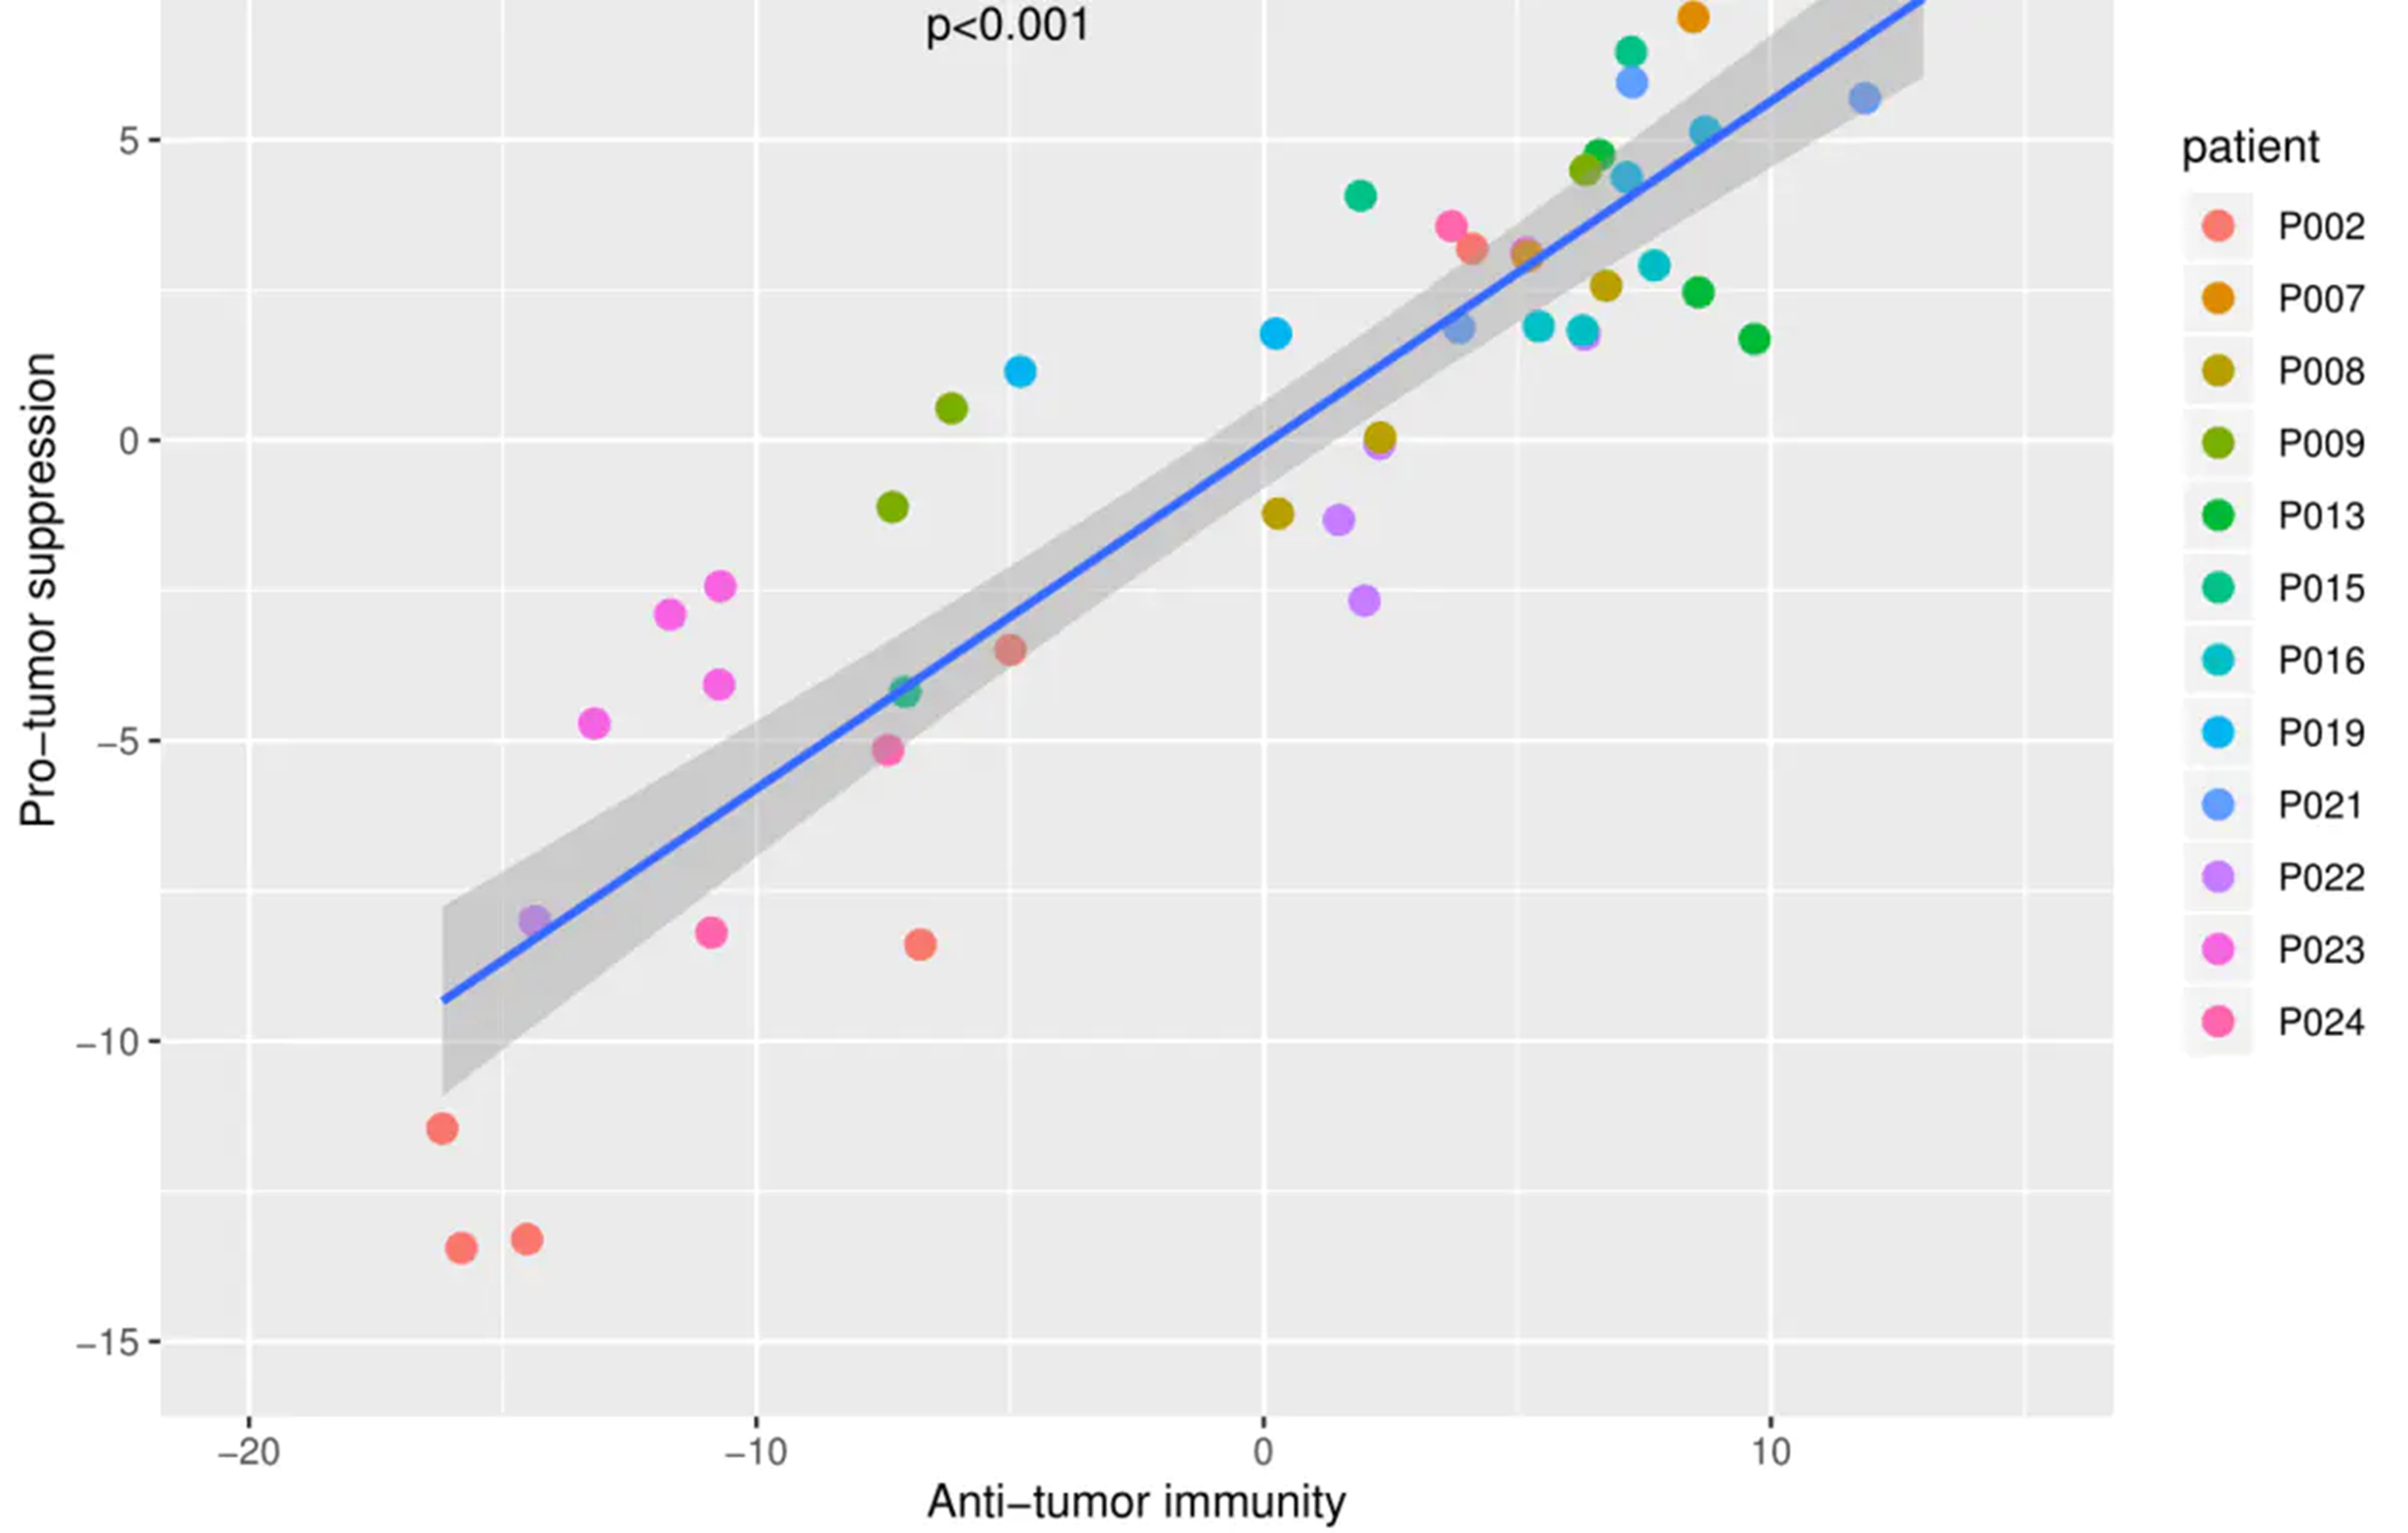
ggplot2绘图
rm(list=ls())
anti_tumor <- c('Activated CD4 T cell', 'Activated CD8 T cell', 'Central memory CD4 T cell', 'Central memory CD8 T cell', 'Effector memeory CD4 T cell', 'Effector memeory CD8 T cell', 'Type 1 T helper cell', 'Type 17 T helper cell', 'Activated dendritic cell', 'CD56bright natural killer cell', 'Natural killer cell', 'Natural killer T cell')
pro_tumor <- c('Regulatory T cell', 'Type 2 T helper cell', 'CD56dim natural killer cell', 'Immature dendritic cell', 'Macrophage', 'MDSC', 'Neutrophil', 'Plasmacytoid dendritic cell')
load('score.Rdata')
anti<- as.data.frame(gsva_matrix1[gsub('^ ','',rownames(gsva_matrix1))%in%anti_tumor,])
pro<- as.data.frame(gsva_matrix1[gsub('^ ','',rownames(gsva_matrix1))%in%pro_tumor,])
anti_n<- apply(anti,2,sum)
pro_n<- apply(pro,2,sum)
patient <- pheno$num2[match(colnames(gsva_matrix1),pheno$num1)]
library(ggplot2)
data <- data.frame(anti=anti_n,pro=pro_n,patient=patient)
anti_pro<- cor.test(anti_n,pro_n,method='pearson')
gg<- ggplot(data,aes(x = anti, y = pro),color=patient) +
xlim(-20,15)+ylim(-15,10)+
labs(x="Anti-tumor immunity", y="Pro-tumor suppression") +
geom_point(aes(color=patient),size=3)+geom_smooth(method='lm')+
annotate("text", x = -5, y =7.5,label=paste0('R=',round(anti_pro$estimate,4),'\n','p<0.001'))
ggsave(gg,filename = 'cor.pdf', height = 6, width = 8)
画相关图,原理和上面差不多
进哥,想请教个问题:(在多个细胞类型中使用相同marker基因的问题)
根据ssGSEA算法的具体实现过程,如果把一个marker放在多种细胞类型分类的操作会带来什么影响,会不会使同时表达该marker的所有细胞类型丰度不正常的升高而造成误判。
进哥 mmc3.xlsx 的文献来源在哪呢?
进哥 mmc3.xlsx 的文献来源在哪呢?
哈喽 想问下这个 mmc3.xlsx文件来源哪个文章呢
我想问下,输入表达矩阵的样本量不同时,基于ssGSEA得到的同一样本的富集分数为什么不一样呢?
请问是不是这篇文章:Local mutational diversity drives intratumoral immune heterogeneity in non-small cell lung cancer,补充文件没有看到mmc3.csv
请问免疫细胞对应基因集合在哪里获取呀,文献的补充文件看了,没有呀?请问是不是这篇文章:Local mutational diversity drives intratumoral immune heterogeneity in non-small cell lung cancer
你好,我想问一下免疫细胞对应基因集合在哪里获取呀?
文献原文下载,删除前两行,保存为mmc3.csv
进哥,请问一下我用自己的表达矩阵算的富集分数为啥会有负值呀
负值没有关系的,tcga里面得到的也有负值,他只是算法得到的score