介绍一个控制热图颜色范围并规定指定值颜色的小技巧。
R包:#install.packages(“pheatmap”)
调用R包:
library(pheatmap)
# Create test matrix
test = matrix(rnorm(200), 20, 10)
test[1:10, seq(1, 10, 2)] = test[1:10, seq(1, 10, 2)] + 3
test[11:20, seq(2, 10, 2)] = test[11:20, seq(2, 10, 2)] + 2
test[15:20, seq(2, 10, 2)] = test[15:20, seq(2, 10, 2)] + 4
colnames(test) = paste("Test", 1:10, sep = "")
rownames(test) = paste("Gene", 1:20, sep = "")
# Draw heatmaps
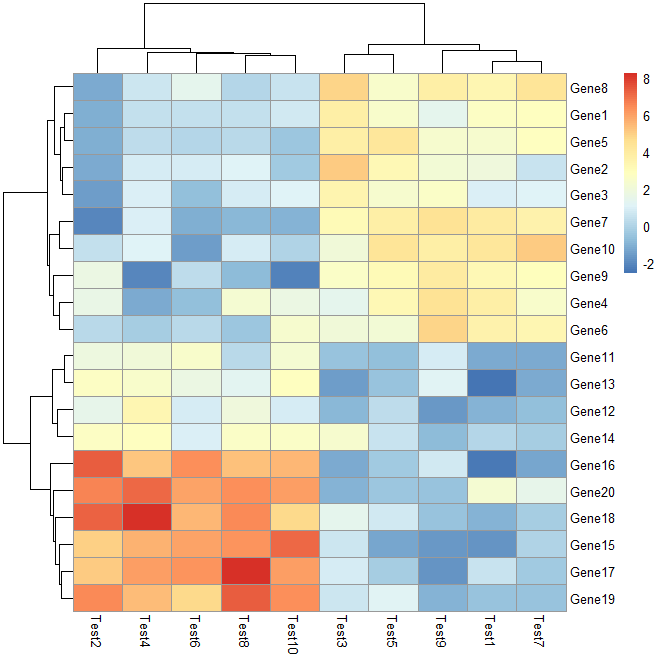
pheatmap(test)
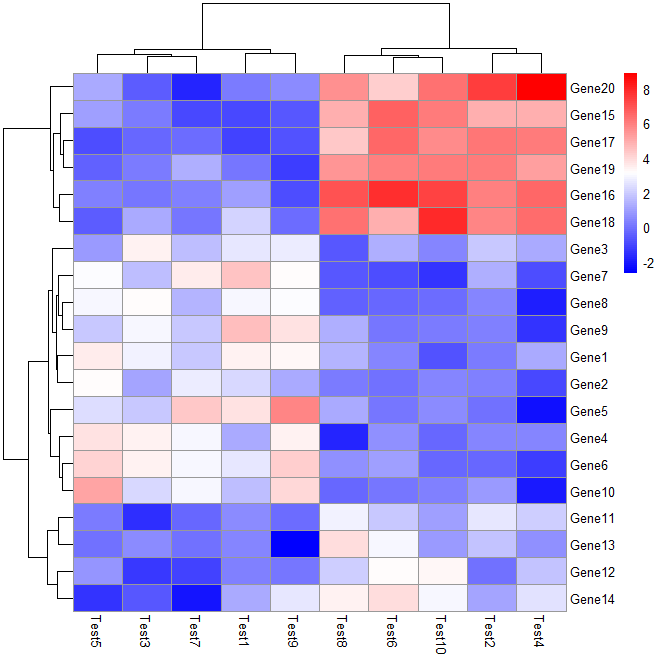
使用上面的矩阵做热图,要求低值为蓝色,高值为红色,中间值为白色:
pheatmap(test,
         scale = "none",
         color = colorRampPalette(colors = c("blue","white","red"))(100)
         )
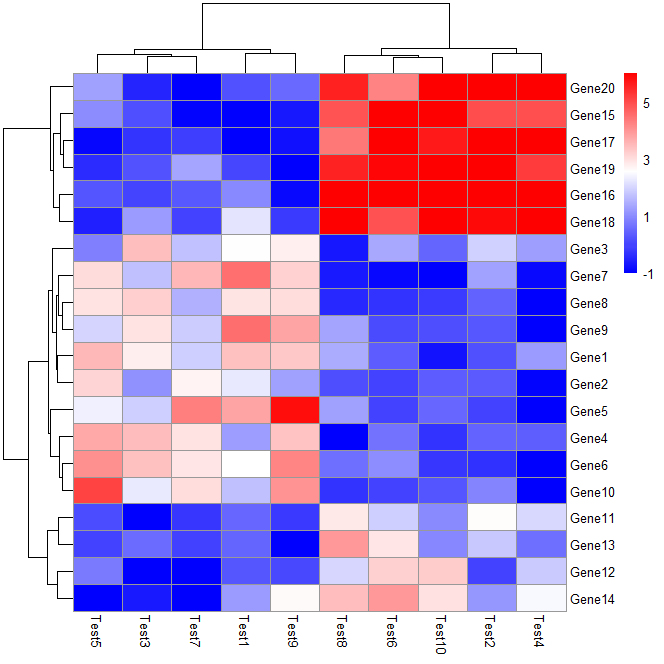
现在要求0的位置为白色,并且色条范围为-1到6,这里使用breaks参数重新定义色条范围并根据break范围划分颜色范围,代码如下:
#breaks

bk <- c(seq(-1,-0.1,by=0.01),seq(0,6,by=0.01))

# Draw heatmaps

pheatmap(test,

scale = "none",

color = c(colorRampPalette(colors = c("blue","white"))(length(bk)/2), colorRampPalette(colors = c("white","red"))(length(bk)/2)),

legend_breaks=seq(-1,5,2),

breaks=bk)
关于colorRampPalette
colorRampPalette 函数支持自定义的创建一系列的颜色梯度
代码示例:
colors <- colorRampPalette(c("blue", "red"))(5)

colors

[1] "#0000FF" "#3F00BF" "#7F007F" "#BF003F" "#FF0000"
函数的参数c(“blue”, “red”) 指的是颜色从蓝色渐变到红色,5 代表创建长度为5的颜色梯度
保存为PDF
pheatmap这个包使用的是grid图形系统而非ggplot2,所以解决方法也是不同的。通过自定义函数来生成,也可一次绘制多个对象的图形。
save_pheatmap_pdf <- function(x, filename, width=7, height=7) {
  stopifnot(!missing(x))
  stopifnot(!missing(filename))
  pdf(filename, width=width, height=height)
  grid::grid.newpage()
  grid::grid.draw(x$gtable)
  dev.off()
}

save_pheatmap_pdf(xx, "C:\\Users\\Jin Wang\\Desktop/test.pdf",8,12)
这个0的地方还是蓝色呀,不是白色?
解决了吗 搞不定加微信 我看看
这篇文章解决了我最近几天的困惑,非常谢谢你!
苏州大学09级放射医学本科生(微信15257180830)
不客气,一起学习,有需要可以来402-2419,一起讨论
我微信 18021308280