library(leaflet)
library(leafletCN)
region=regionNames("苏州")
dat = data.frame(region,runif(length(region)))
dat <- edit(dat)
map = leafletGeo("苏州", dat)
dh<-read.delim("I:/地图/坐标.txt")
####dh文件包含地点,地点坐标(即经纬度XY),还有相关设置标记大小的列
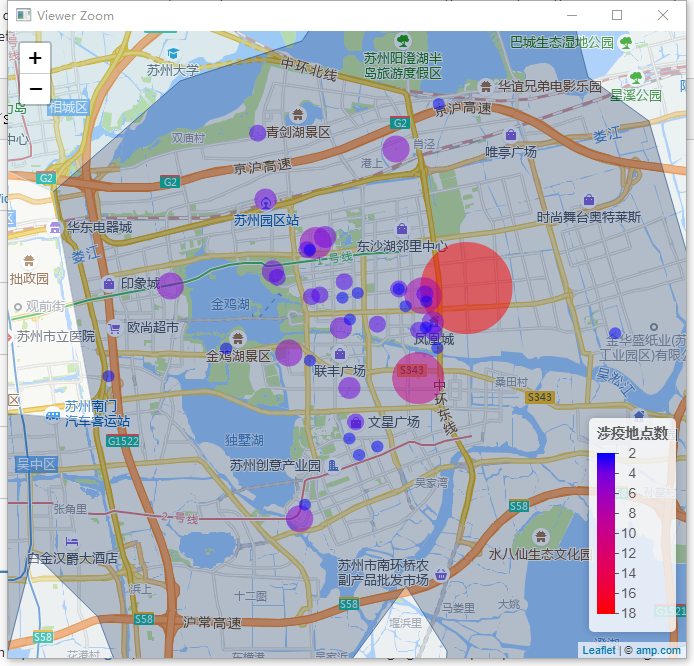
cPal <- colorNumeric(palette = c("blue","red"),domain = dh$地区)
#涂色环节
pal <- colorNumeric(
palette = c("Blues"),
domain = map$value)
m<-leaflet(map) %>% amap() %>%
#加入框边界及颜色
addPolygons(stroke = TRUE,
smoothFactor = 1,
fillOpacity = 0.3,
weight = 1,
color = ~pal(value),
popup = ~htmltools::htmlEscape(popup)
)%>%addCircles(lng = dh$X,lat = dh$Y,weight=dh$地区*5,color = ~cPal(dh$地区)) %>%
addLegend("bottomright", pal = cPal, values = ~dh$地区,title = "地点数",opacity = 1) %>% addLabelOnlyMarkers(lng = dh$X,lat = dh$Y,"00")
saveWidget(m, "I:/地图/temp.html", selfcontained = FALSE)
webshot("temp.html", file = "Rplot.png",
cliprect = "viewport")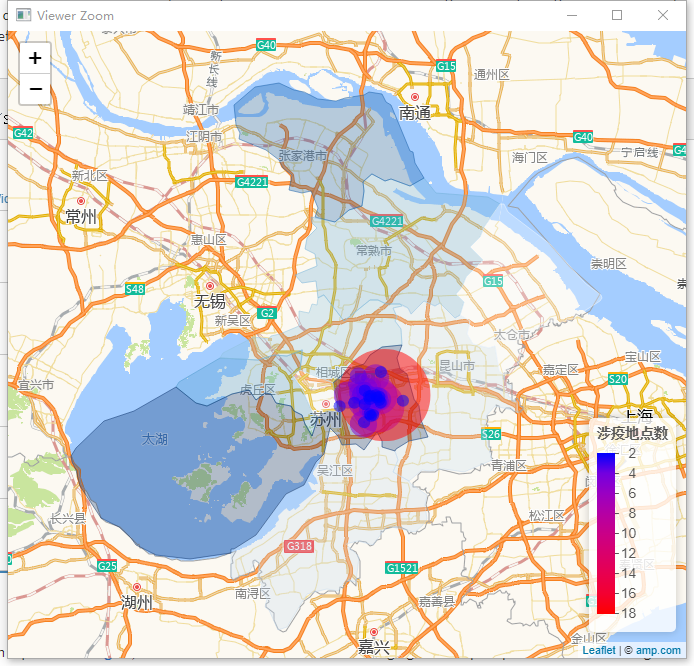
更多设置参考:
R语言在线地图神器:Leaflet for R包(三) 符号标记_微信公众号:虾神说D-CSDN博客_r语言leaflet包