最近有不少人留言讨论DNA甲基化相关实验,其中也有关于BSP sequence结果分析的,本来想自己做个分析的小程序,结果找到这个功能强大的Shiny APP,分享给大家!!!
作者提供了源码,但是没有在线部署,需要的小伙伴有一点R语言基础可以试试,进哥后续有时间看需要将其修改修改,部署在网站上。
Github源码链接:https://github.com/ABSP-methylation-tool/ABSP/tree/ABSP
以下为原文介绍,不想翻译了,大家自己看看。

ABSP, standing for “Analysis of Bisulfite Sequencing PCR”, is an R based tool to analyze CpG methylation profiles using data from Bisulfite Sequencing PCR (BSP) experiment results. It was developed to help researchers to estimate and compare methylation percentages of a DNA region studied using BSP experiments. It provides a complete automated workflow, from trace file sequencing results to data visualization and statistics.
For more detailed information, please read the ABSP User Guide document.
Citation
If you use ABSP in your published work, please cite:
Denoulet et al. (2023), ABSP: an automated R tool to efficiently analyze region-specific CpG methylation from bisulfite sequencing PCR, Bioinformatics, Volume 39, Issue 1, btad008, https://doi.org/10.1093/bioinformatics/btad008IF: 6.931 Q1
Availability
ABSP was developed on a Windows machine but is functional on MacOS and Linux devices. Please note that on Linux machine, the packages installation at the first opening of ABSP can take a long time.
Quick start guide
Installation
- Download the ABSP files from GitHub (Go to “Releases” in the right panel and in the “Assets” section of the latest release, download the ABSP .zip or .tar.gz file) and extract/unzip the folder
- Install software: R at https://www.r-project.org/ and RStudio at https://www.rstudio.com/products/rstudio/download/
Open the ABSP app
- Open the “ABSP Rproject.Rproject” file with Rstudio
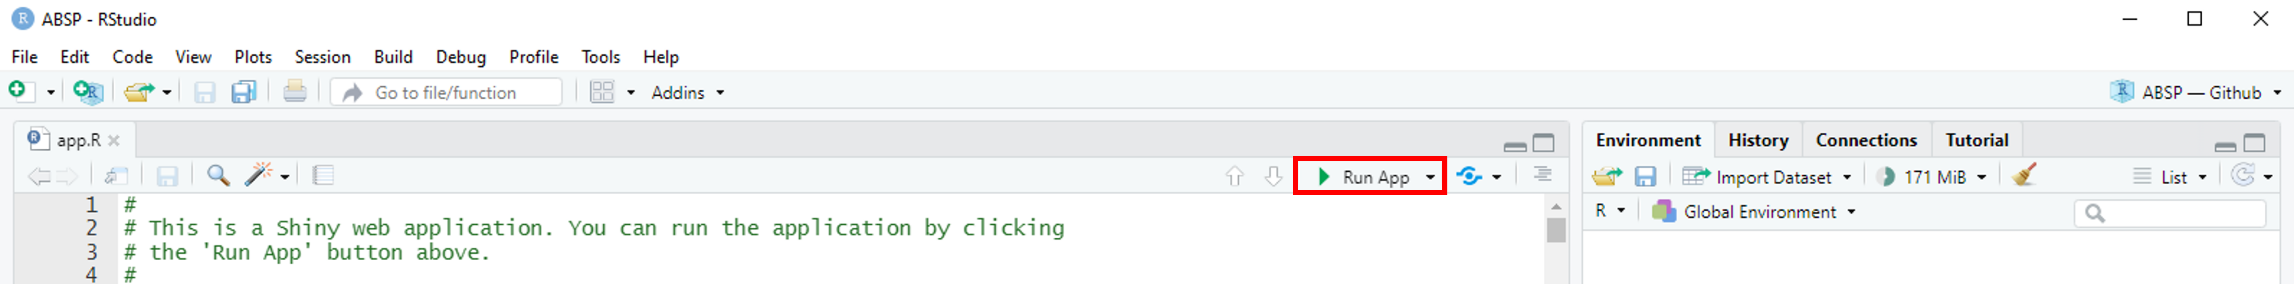
- Open the “app.R” file with Rstudio
- Click on the “Run App” button at the top right corner (you can select “Run external” to open it in web browser)
- If a pop-up window appears about the shiny package, click on “Yes” to accept the shiny package installation
Analysis with ABSP
Find example data of inputs and outputs in the “examples” folder.
Individual sample analysis:
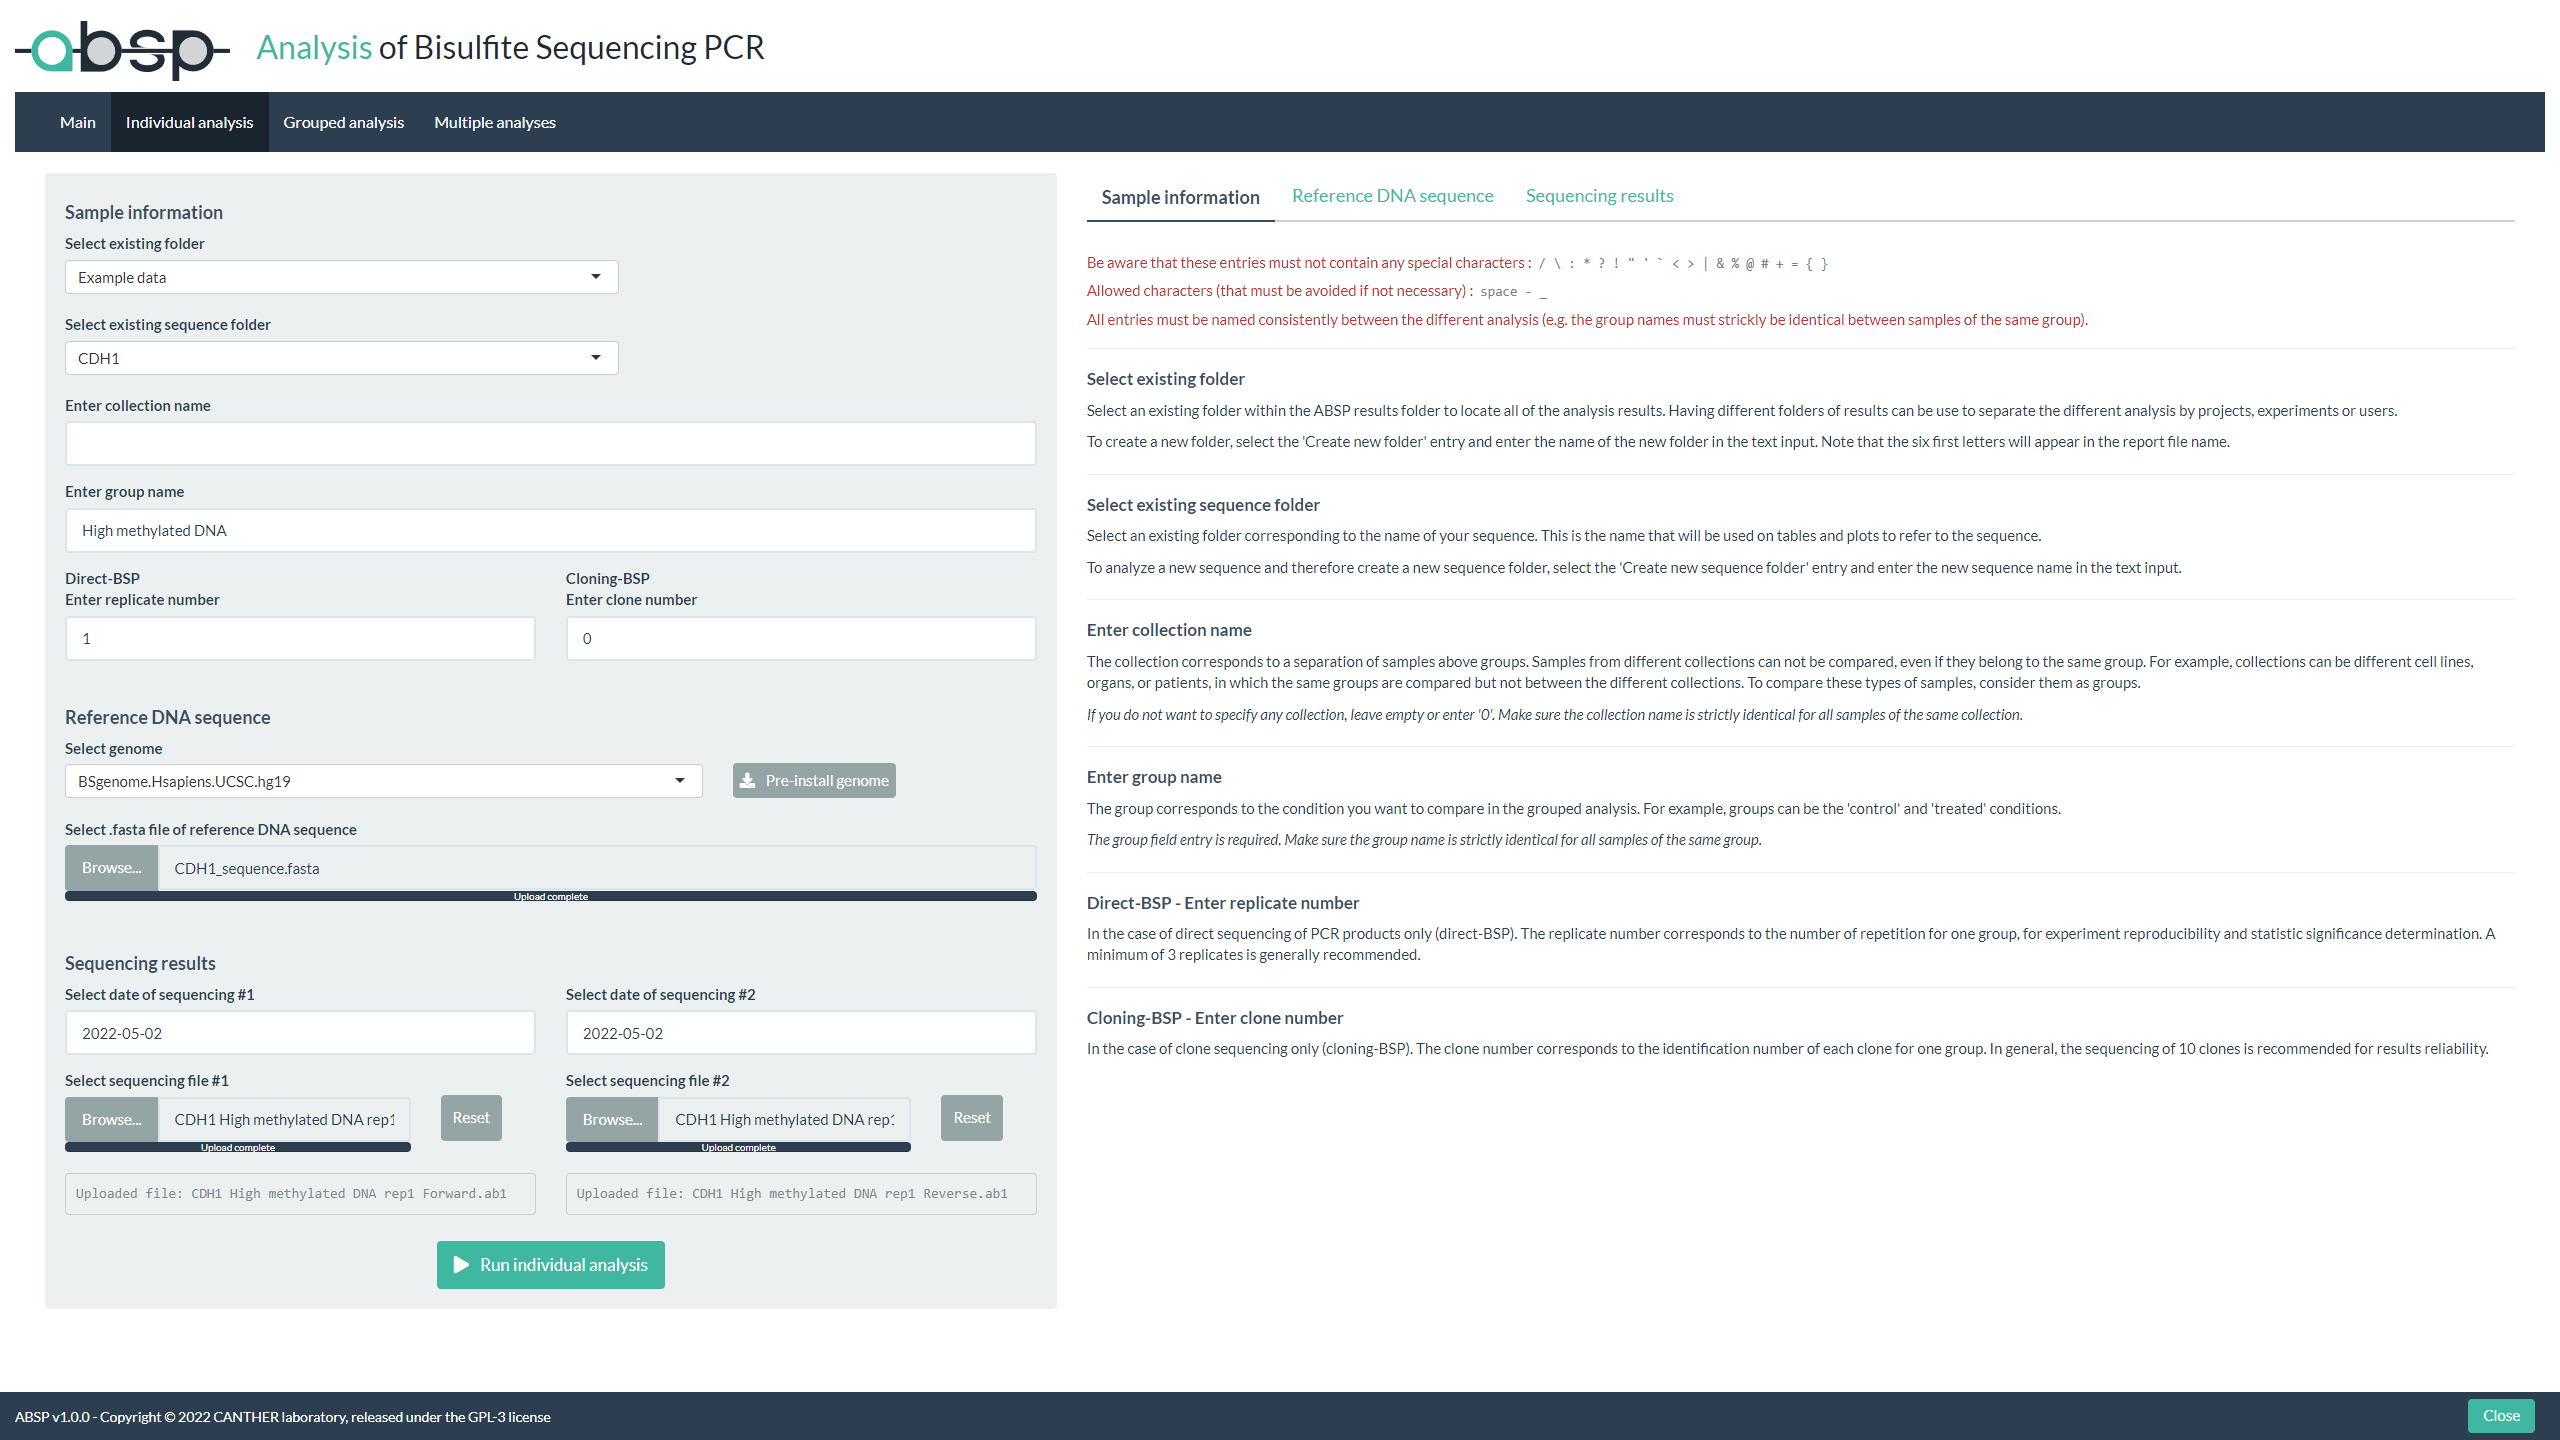
- In the “Individual analysis” tab, fill the entries and add input files (reference sequence .fasta file and sequencing .ab1 files)
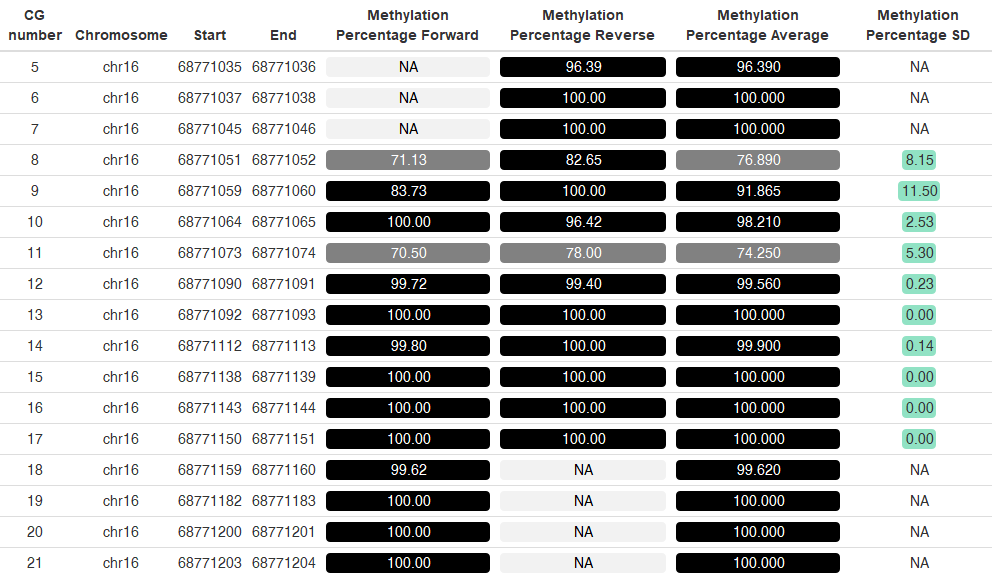
- Run the analysis to compute the CpG methylation levels of your sample
- View the results in the .html report generated in your “reports” folder
- Look for output files in your “results” folder
Grouped samples analysis:
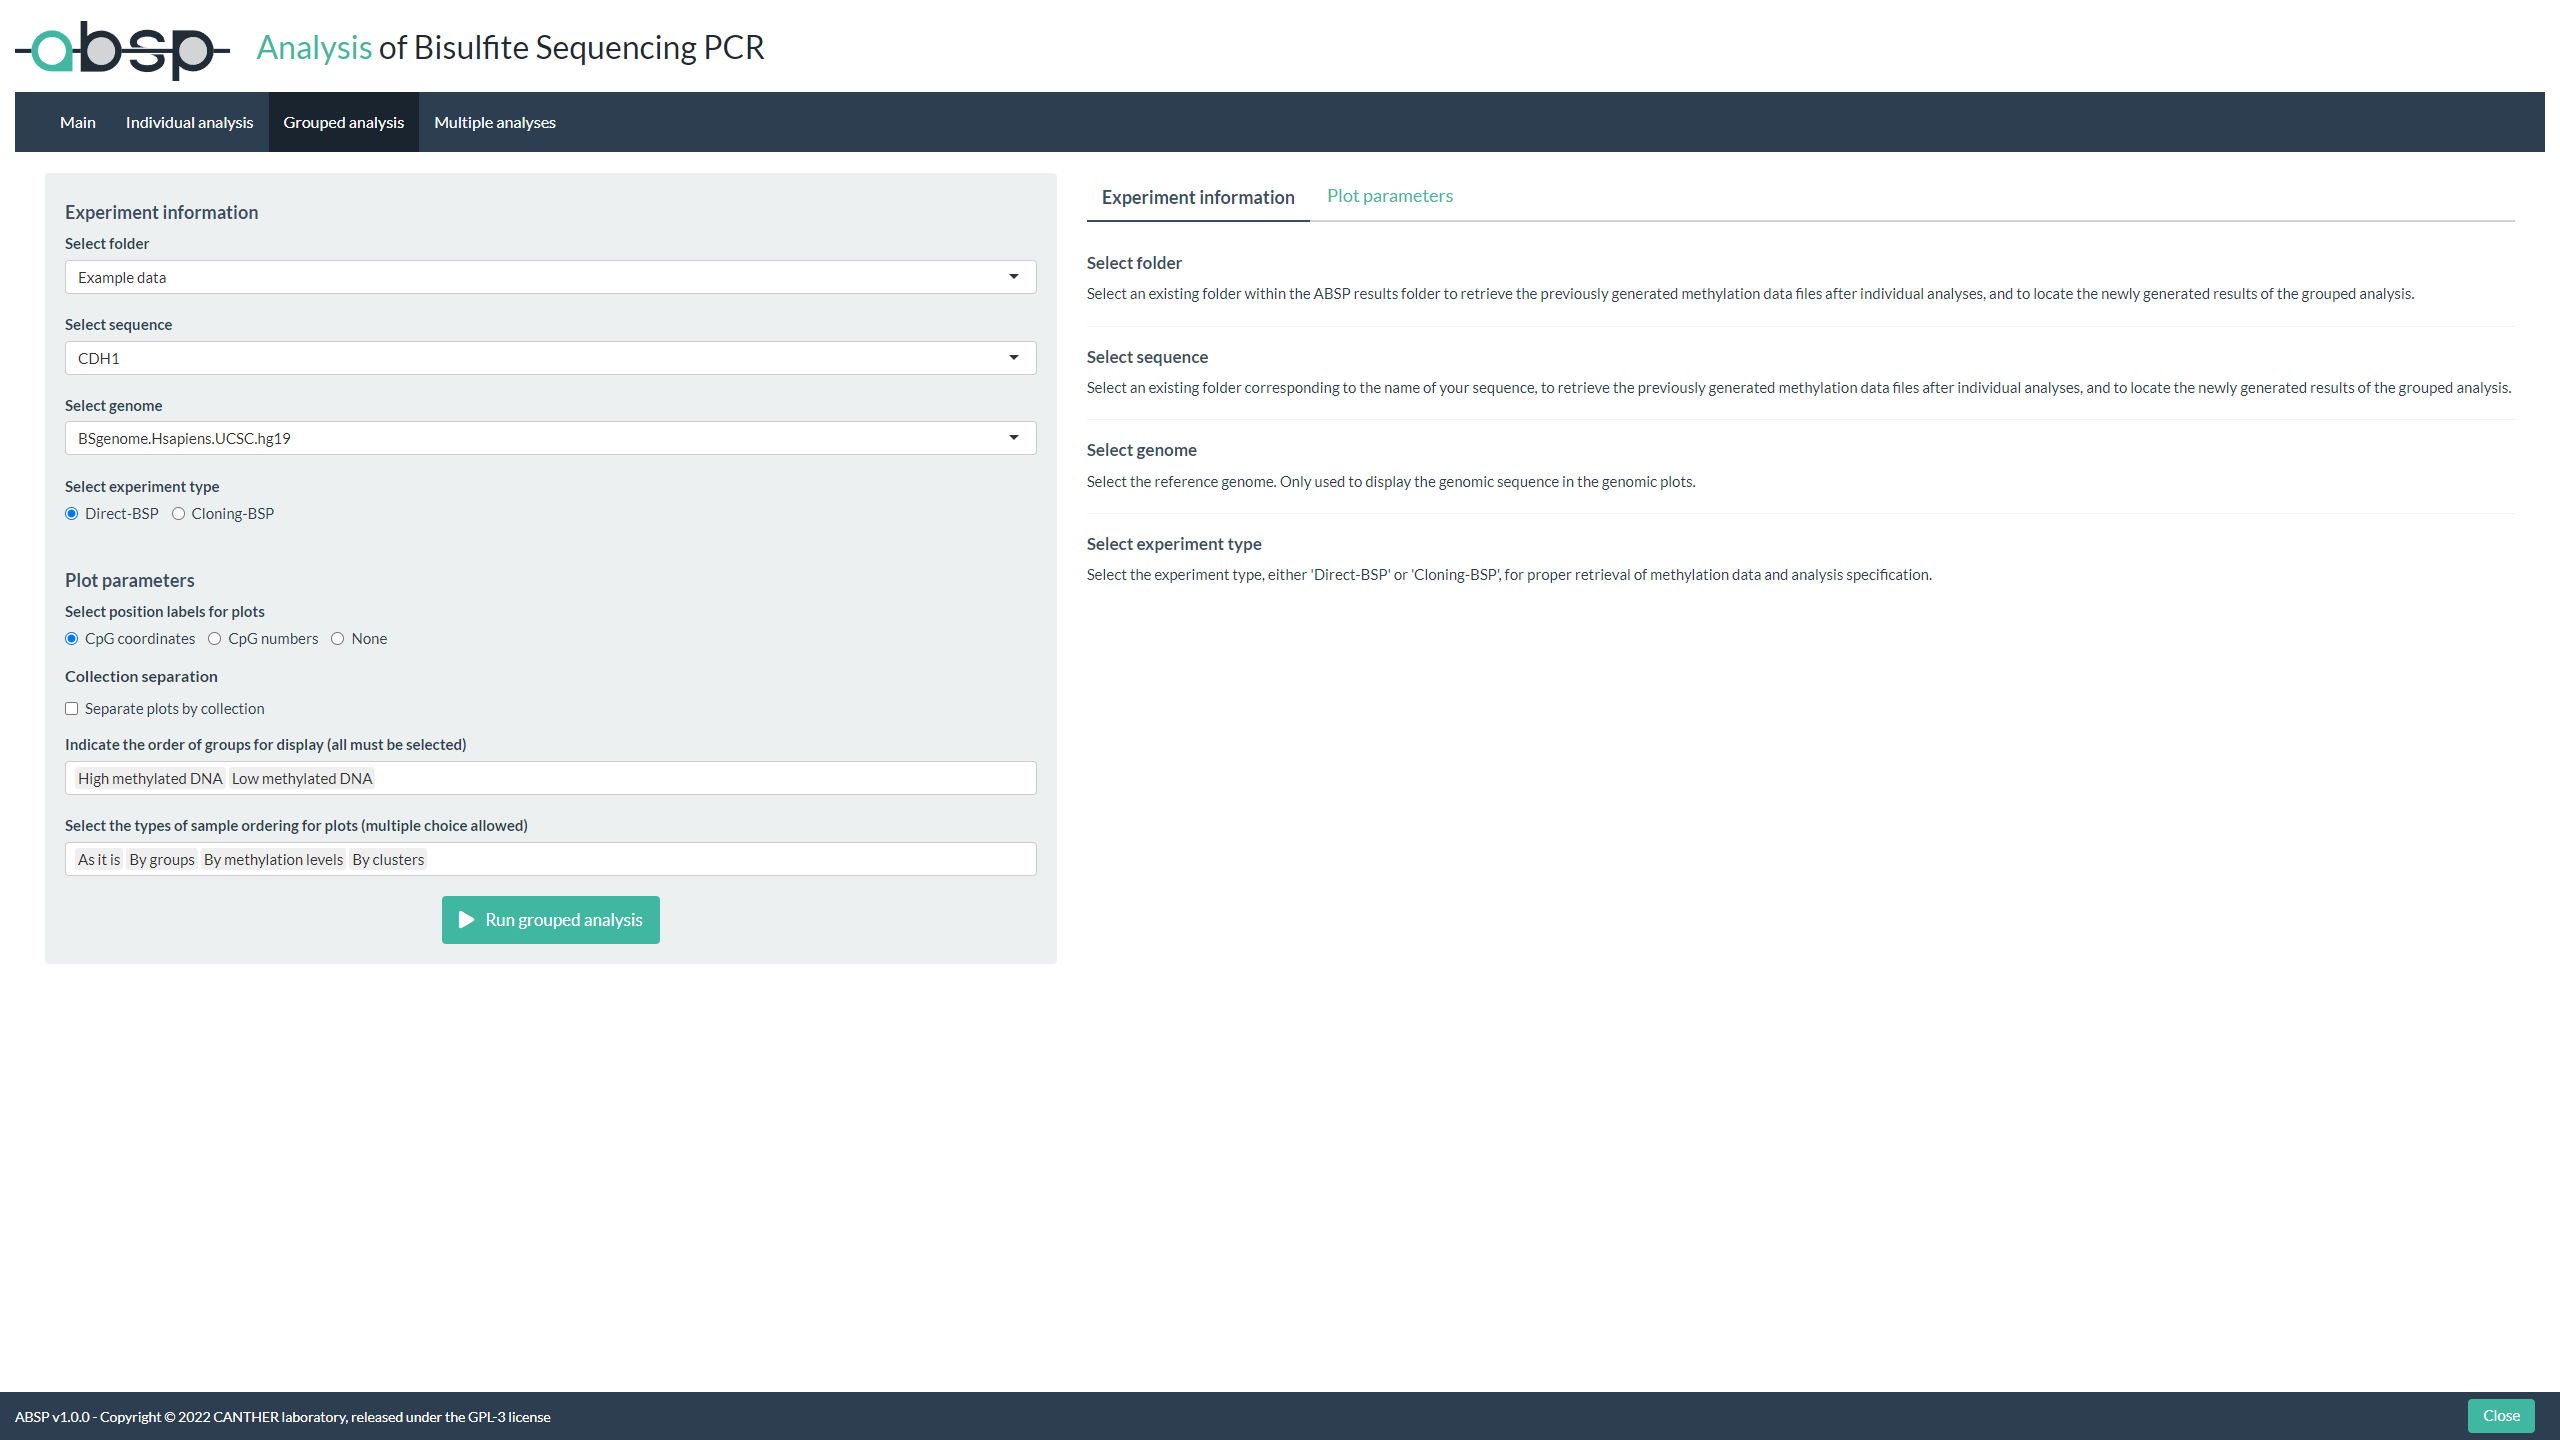
- Once all of your samples have been individually analyzed, in the “Grouped analysis” tab, fill the entries and choose your parameters for plotting
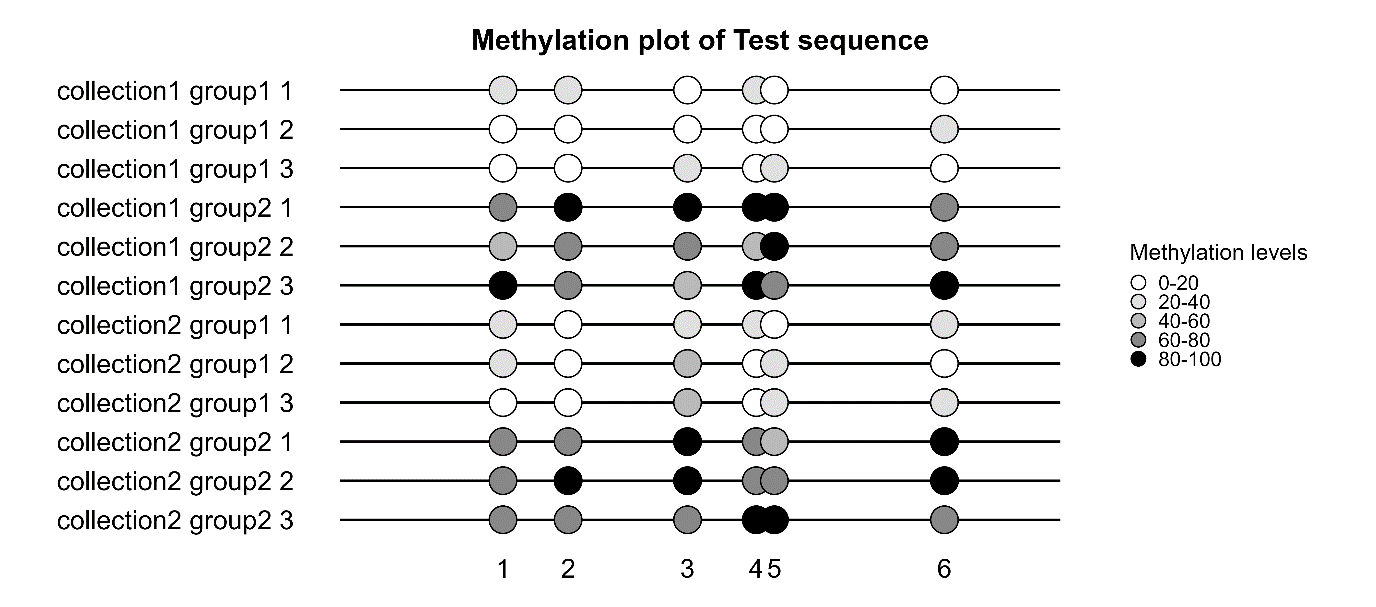
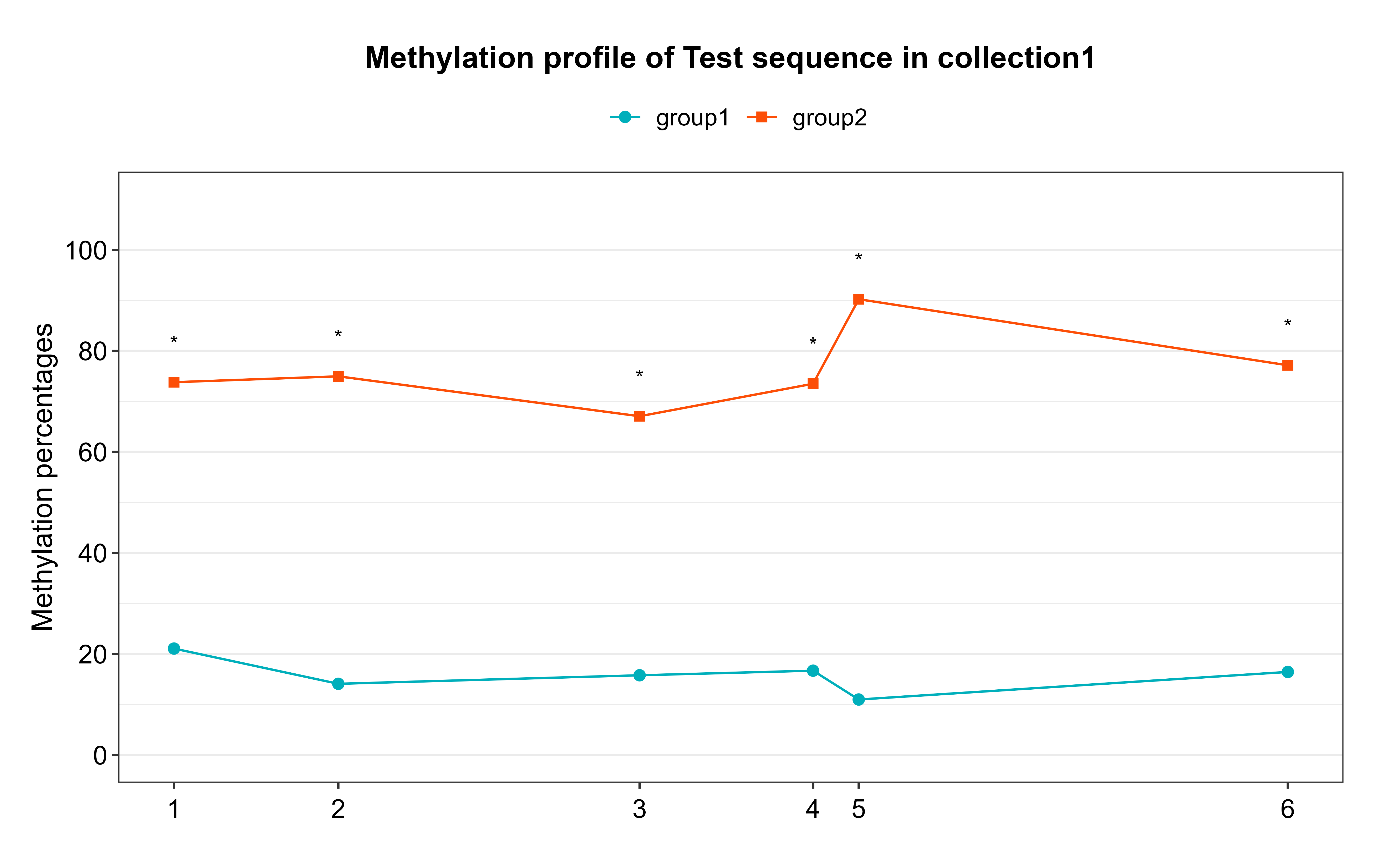
- Run the analysis to gather samples, generate visualization plots (lollipop plots) and compare methylation data between groups by comparative statistics
- View the results in the .html report generated in your “reports” folder
- Look for output files in your “results” folder
Launch multiple analysis:
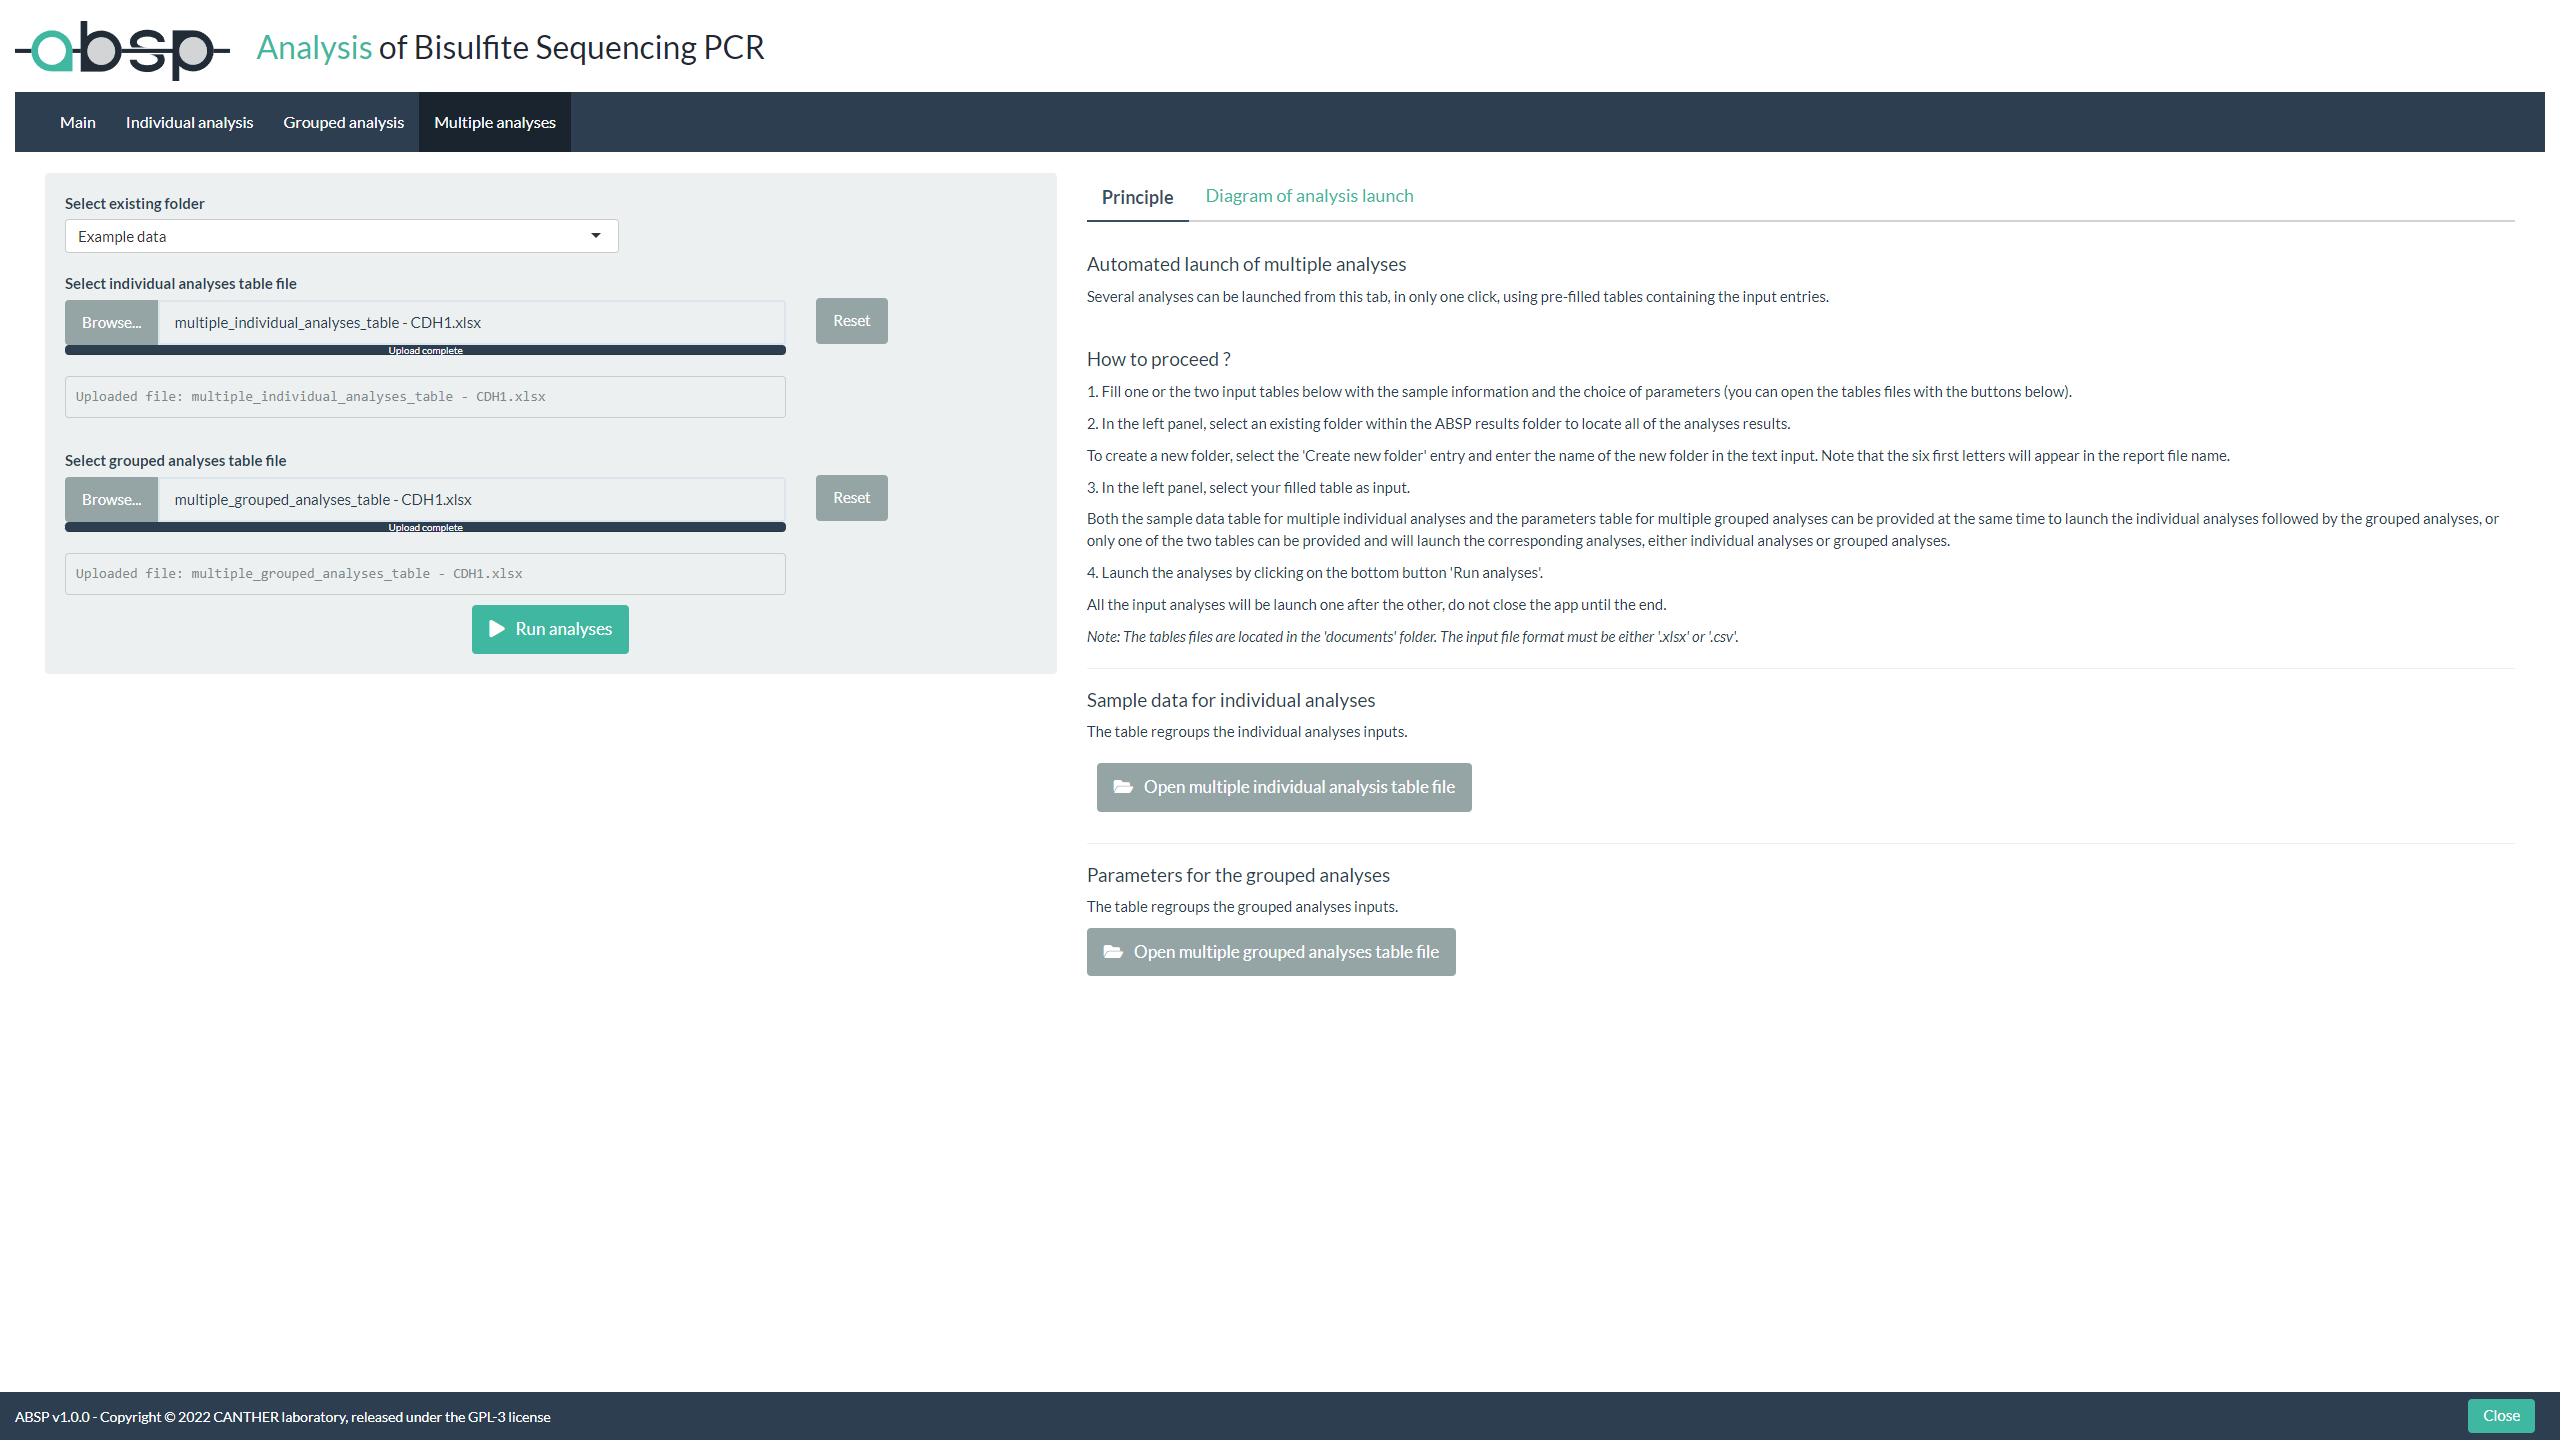
The “Multiple analysis” tab is useful to analyze multiple samples and/or for multiple grouping analysis, launched in one click, using as input tables filled with the required input entries.