Transcription factors (TFs) are pivotal regulatory proteins that modulate gene expression by binding to specific DNA sequences, thus orchestrating cellular function and organismal development. Unraveling the complex interactions between TFs and their target genes is crucial for understanding the molecular underpinnings of biological processes and disease states [1,2]. Traditionally, the identification of interactions between transcription factors (TFs) and their target genes has relied on labor-intensive and time-consuming experimental methods. However, with the rapid advancement of high-throughput analytical techniques, particularly chromatin immunoprecipitation sequencing (ChIP-seq) and RNA sequencing (RNA-seq), it has become possible to predict TF target genes on a genomic scale [3]. ChIP-seq maps the associations between TFs and DNA, while RNA-seq identifies changes in RNA levels associated with perturbations in TF activity [4]. In recent years, the rise of computational biology has led to the development of various web-based tools that predict TF-target gene relationships using unique algorithms and databases. The JASPAR database offers a collection of high-quality transcription factor DNA binding motifs, providing core data for bioinformatics analysis and a powerful predictive tool for experimental design [5,6]. Based on transcription factor knockout experiments, the KnockTF database systematically compiles data on the effects of knockouts on gene expression, providing valuable experimental evidence for TF function studies [7,8]. Here, we introduce a novel web application developed using the R programming language, designed to predict target genes of transcription factors and vice versa. Our application synergizes the predictive capacities of multiple web tools by intersecting their results to enhance reliability. Additionally, it incorporates gene expression correlation analysis as a filter to refine the predictions. This integrative approach offers a comprehensive and efficient strategy for the elucidation of transcriptional networks, providing a valuable resource for the research community to advance the field of gene regulatory mechanisms.
Methods
Transcription Factor Databases
This Shiny application has incorporated seven major transcription factor databases (Table1), namely MotifMap[9,10], hTFtarget[11], KnockTF[7,8], TRRUST[12,13], Cistrome DB[14], ENCODE[15], and JASPAR[6]. For MotifMap, hTFtarget, TRRUST, and Cistrome, we utilized the R packages “httr,” “rvest,” “curl,” and “xml2” to simulate web page access for retrieving transcription factor-target gene data. For JASPAR and ENCODE, we acquired pre-processed datasets from Harmonizome[16] (https://maayanlab.cloud/Harmonizome/) and uploaded them to the server’s MySQL database. For KnockTF, we downloaded the entire dataset of differential expression results available from the KnockTF2.0 website and uploaded it to the MySQL database for accessibility.
Table1. Information of databases used in this shiny application
Data type | Datasets | DB link | Data source | Evidence |
TF database | MotifMap[9,10] | http://motifmap.ics.uci.edu/ | http://motifmap.ics.uci.edu/ | motifs |
hTFtarget[11] | https://guolab.wchscu.cn/hTFtarget/#!/ | http://bioinfo.life.hust.edu.cn/hTFtarget#!/ | ChIP-Seq data | |
KnockTF[7,8] | https://bio.liclab.net/KnockTFv1/ | https://bio.liclab.net/KnockTF/index.php | Knockdown/knockout | |
TRRUST[12,13] | https://www.grnpedia.org/trrust/ | https://www.grnpedia.org/trrust/ | Pubmed | |
Cistrome DB[14] | http://cistrome.org/db/ | http://cistrome.org/db/#/ | ChIP-Seq and DNase-Seq | |
ENCODE[15] | https://www.encodeproject.org/ | https://maayanlab.cloud/Harmonizome/dataset/ENCODE+Transcription+Factor+Targets | ChIP-Seq data | |
JASPAR[6] | https://jaspar.elixir.no/ | https://maayanlab.cloud/Harmonizome/dataset/JASPAR+Predicted+Transcription+Factor+Targets | motifs | |
Gene expression database | GTEx[17] | https://www.genome.gov/Funded-Programs-Projects/Genotype-Tissue-Expression-Project | https://xenabrowser.net/datapages/?dataset=gtex_rsem_isoform_tpm&host=https%3A%2F%2Ftoil.xenahubs.net | gene expression RNAseq |
TCGA[18] | https://portal.gdc.cancer.gov/ | https://xenabrowser.net/datapages/?dataset=tcga_RSEM_gene_tpm&host=https%3A%2F%2Ftoil.xenahubs.net | gene expression RNAseq | |
CCLE[19] | https://sites.broadinstitute.org/ccle/ | https://xenabrowser.net/datapages/?dataset=ccle%2FCCLE_DepMap_18Q2_RNAseq_RPKM_20180502&host=https%3A%2F%2Fucscpublic.xenahubs.net&removeHub=https%3A%2F%2Fxena.treehouse.gi.ucsc.edu%3A443 | gene expression RNAseq |
Gene Expression Databases
To explore the correlation between TFs and target genes expression, this Shiny app integrates analyses using The Genotype-Tissue Expression (GTEx), The Cancer Genome Atlas Program (TCGA), and Cancer Cell Line Encyclopedia (CCLE) databases. Here is their basic introduction:
- The GTEx (Genotype-Tissue Expression) project database provides extensive reference data for gene expression and its variability in different normal human tissues, enabling researchers to understand how gene expression is influenced by genetic background on a broader scale [17].
- The TCGA (The Cancer Genome Atlas) database collects multidimensional cancer genomic data including gene expression, mutations, copy number variations, and epigenetic data, offering strong support for the discovery of cancer biomarkers and therapeutic targets [18].
- The CCLE (Cancer Cell Line Encyclopedia) database provides a wealth of gene expression, mutation, and epigenetic characteristic data for numerous cancer cell lines, serving as a crucial resource for studying cell line-specific responses and drug screening [19].
These resources provide extensive transcriptomic data from healthy and cancerous tissues or cells, essential for predicting TF-target interactions. We apply the correlation analysis between the expression of TFs and targets based on these datasets to enhance the predictive property. The analyses are performed using R and results are dynamically presented in the app, offering users a clear view of the TF-gene expression relationships.
Software
Our Shiny application was exclusively developed using R (version 4.3.0) and encompasses all stages of development from data extraction and correlation analysis to data visualization and user interface (UI) design. The key R packages employed in the construction of this application are summarized in the table below, indicating their specific uses such as UI construction, web data retrieval, XENA database (https://xena.ucsc.edu/) [20] data extraction, MySQL database access and visualization (Table2).
Table2. Key R packages and their functions in shiny application development
R Package | Function |
|---|---|
shiny | Building interactive web application UI |
bs4Dash | Advanced UI design with Bootstrap 4 integration |
httr | Handling HTTP requests for web data retrieval |
rvest | Web scraping functionalities |
curl | Data transfer with URL syntax |
jsonlite | Parsing JSON data |
UCSCXenaShiny[21] | Extracting gene expression data from XENA database |
RMySQL | Accessing and extracting database data |
VennDiagram | Venn diagram visualization |
Results
Module 1: Procedures for the prediction of the target genes of TF
This systematic approach enables a thorough analysis of TF-target gene interactions, bolstering the robustness of predictions by harnessing the combined strength of multiple dataset intersections. The procedural steps are as follows:
- Input a TF name: Users initiated the process by selecting a TF of interest from a dropdown list.
- Select datasets: Participants then chose the predictive tools to include in the analysis. Notably, if “KnockTF” was selected, an additional interface element appeared: a slider for setting the log2 fold-change (Log2FC) threshold, along with a checkbox to include only downregulated genes. This specification is necessary as KnockTF predictions are based on differential gene expression data following TF knockdown or knockout.
- Initiate prediction: By clicking the “Go” button, users commenced the predictive analysis.
- View results: After a short wait, the prediction outcomes were displayed on the “All results” tab, which encompassed individual tool results and the intersected findings.
- Intersection selection: Given that some tools may yield sparse predictions or lack data, we provided an option box to select well-predicted datasets for intersection analysis, which is visualized through a Venn diagram.
- Visualize intersections: The “Venn diagram” tab allowed for the visualization of overlapping predictions across multiple tools using Venn or petal diagrams.
- Individual dataset review: The “Individual dataset” tab enabled viewing and downloading detailed information for each tool’s predictive results.
Herein, we demonstrate the predictive workflow and outcomes using STAT3 as an example within this module. The integration analysis for prediction was conducted using four tools: hTFtarget, MotifMap, Jaspar, and KnockTF. For KnockTF, a log2 fold change (log2FC) threshold of 0.5 was set, including only downregulated genes (Figure 1A). The results indicated that we identified 6358, 3485, 2740, and 3730 putative target genes from each tool respectively (Supplementary file 1), while the intersection of these tools yielded only 42 target genes (Figure 1B). Furthermore, the prediction results from each tool can be further viewed and downloaded in the Individual dataset section (Figure 1C).
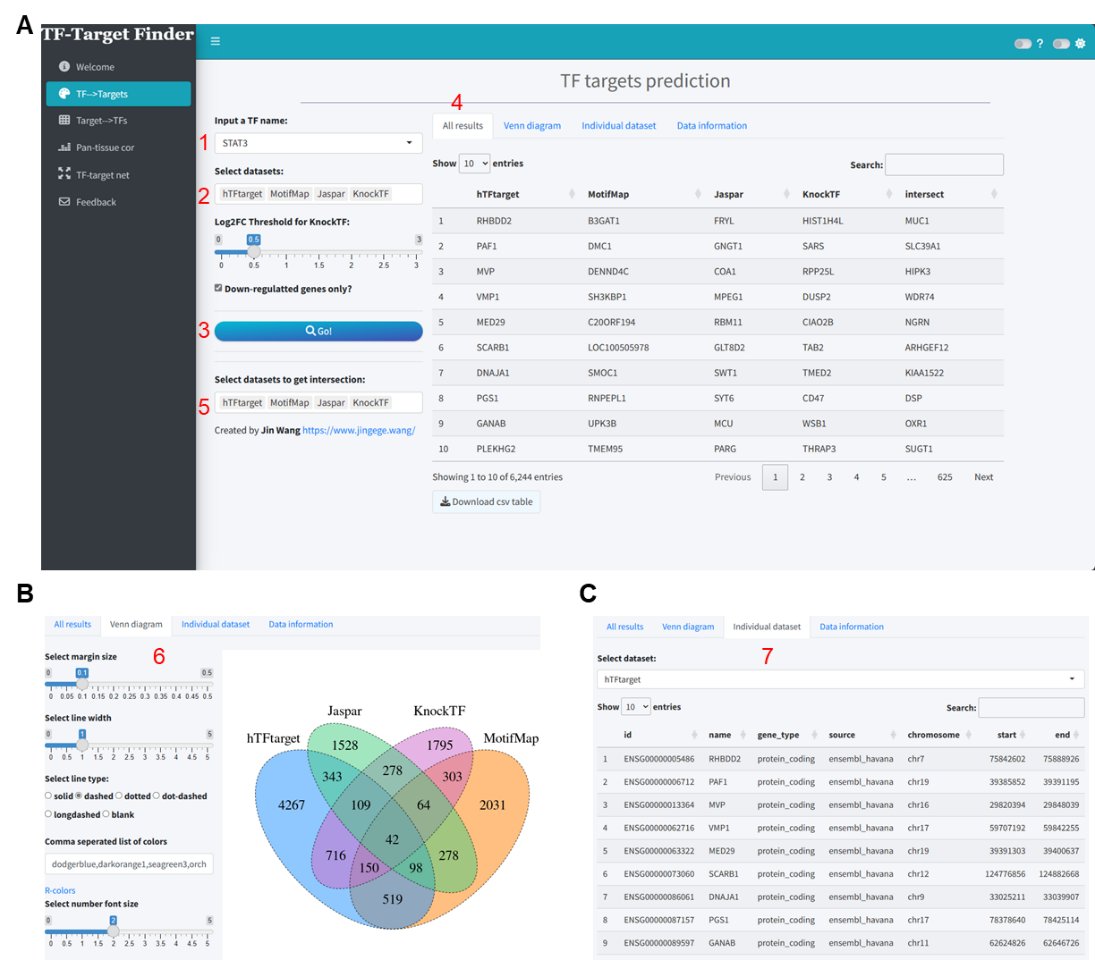
Figure 1. Visualization of STAT3 target prediction results utilizing the TF-Target Finder Shiny app. (A) Parameter setting and display of predictive outcomes; (B) A Venn diagram depicting the intersections of predicted results from four tools; (C) The Individual dataset interface showing results from a single dataset, exemplified by hTFtarget predictions. TF, transcription factor.
Module 2: Procedures for the prediction of upstream TFs of target genes
This integrated approach, combining gene expression correlation analysis with multi-dataset intersection, was designed to ensure a comprehensive and reliable prediction of TF-target gene interactions. The operational steps are detailed below:
- Input a target gene symbol: Such as GAPDH.
- Select datasets: Participants then chose the predictive tools to include in the analysis. Notably, if “KnockTF” was selected, an additional interface element appeared: a slider for setting the log2 fold-change (Log2FC) threshold, along with a checkbox to include only downregulated genes. This specification is necessary as KnockTF predictions are based on differential gene expression data following TF knockdown or knockout.
- Correlation analysis: Researchers began by choosing the data type for correlation analysis through the “Correlation” selection box, with options including data from TCGA, GTEx, or a combination of both.
- Tissue type selection: Users selected specific cancer types from the TCGA database and/or normal tissue types from the GTEx database to tailor the correlation analysis to their research interests.
- Correlation parameter setting: The method of correlation analysis and the cutoff for the correlation coefficient were set, allowing for the customization of the stringency of the correlation criteria.
- Initiate prediction: The “Go” button was clicked to start the prediction analysis, incorporating the correlation parameters specified.
- Results display: After a brief processing period, the predictive results, including the outcomes from individual tools and the intersected data, were displayed on the “All results” tab.
- Intersection selection: Similar to Module 1, we provided the option to select datasets with robust predictions for intersection analysis, with the results visualization through a Venn diagram.
- Visualization of Intersections: By navigating to the “Venn diagram” tab, users could visualize the intersection results between different datasets.
- Dataset Details: Detailed information regarding the predictive results from each tool could be viewed and downloaded from the “Individual dataset” tab.
Using GAPDH as another exemplar, we incorporated five tools—hTFtarget, ENCODE, Jaspar, Cistrome, and KnockTF—alongside correlation analysis with GTEx lung tissue and TCGA lung adenocarcinoma data (correlation method: Pearson, correlation coefficient threshold: 0.3) (Figure 2A). The combined prediction analysis of these five tools and two datasets yielded 627, 137, 13, 1000, 45, 1223, and 243 transcription factors, respectively (Supplementary file 2). Unfortunately, no intersecting transcription factors were identified across these seven datasets (Figure 2B). However, upon removing Cistrome and Jaspar from the “Select datasets to get intersection” dropdown, an intersection of the remaining five datasets revealed two TFs: FOXM1 and YY1 (Figure 2C). Similarly, individual dataset results can be viewed and downloaded from the Individual dataset section (Figure 2D).
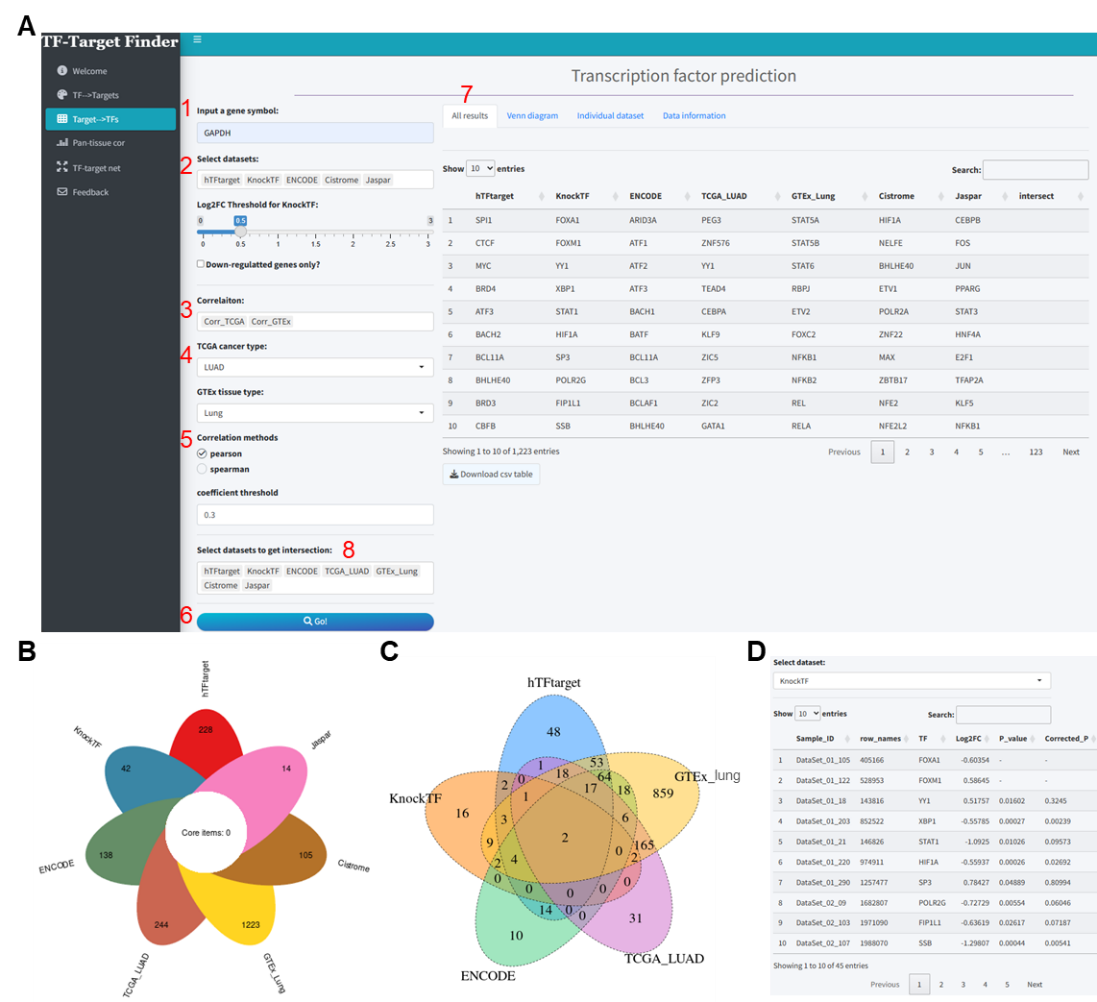
Figure 2. Predictive analysis of TFs regulating GAPDH using the TF-Target Finder Shiny app. (A) Parameter setting and display of predictive results; (B) A petal diagram illustrating the outcomes of five predictive tools and two correlation analyses, along with their intersections; (C) A Venn diagram showing the intersections of predictions from three tools and two correlation analyses; (D) The Individual dataset interface with KnockTF predictions exemplifying results from a single dataset. TF, transcription factor.
Module 3: Pan-tissue correlation analysis between the expression of predicted TF-target pair
In this module, we utilized data from three publicly available databases to analyze the expression correlation of TF-target pairs across various tissue types. The integration of these analyses enables a comprehensive assessment of the expression relationship between the TFs and their potential target genes in a context-specific manner. The methodological steps are detailed as follows:
- TF and target gene input: The user begins by selecting a transcription factor and entering the symbol for the target gene.
- Database selection: The database(s) for analysis are chosen from among TCGA, GTEx, and CCLE. Notably, upon selecting TCGA, a popup menu appears, offering the user the option to include tumor data exclusively.
- Correlation analysis parameters: Parameters for correlation analysis are set, including the selection of the analysis method and the establishment of thresholds for the correlation coefficient and p-value.
- Initiate analysis: Data retrieval and correlation analysis are initiated by clicking the “Go” button.
- Correlation results and scatter plot: Subsequently, the results of the correlation analysis are presented, along with a scatter plot illustrating the expression correlation.
- Plotting parameter: Options are provided to adjust parameters relevant to the scatter plot visualization.
- Detailed scatter plot: Clicking on a row within the results table prompts a popup window that displays a detailed scatter plot for the expression of the two genes within a single tissue type.
We evaluated the correlation between FOXM1 and GAPDH across pan-cancer samples in the TCGA database, using a Pearson correlation method with a coefficient threshold of 0.3 and a P-value threshold of 0.05 (Figure 3A). The results indicated a significant positive correlation between FOXM1 and GAPDH expression in the majority of cancers (Figures 3A-B, Supplementary file 3). Upon selecting LUAD, we obtained the interface as shown in Figure 3C, where the scatter plot demonstrates the correlation between these two genes in TCGA-LUAD (correlation coefficient = 0.676).
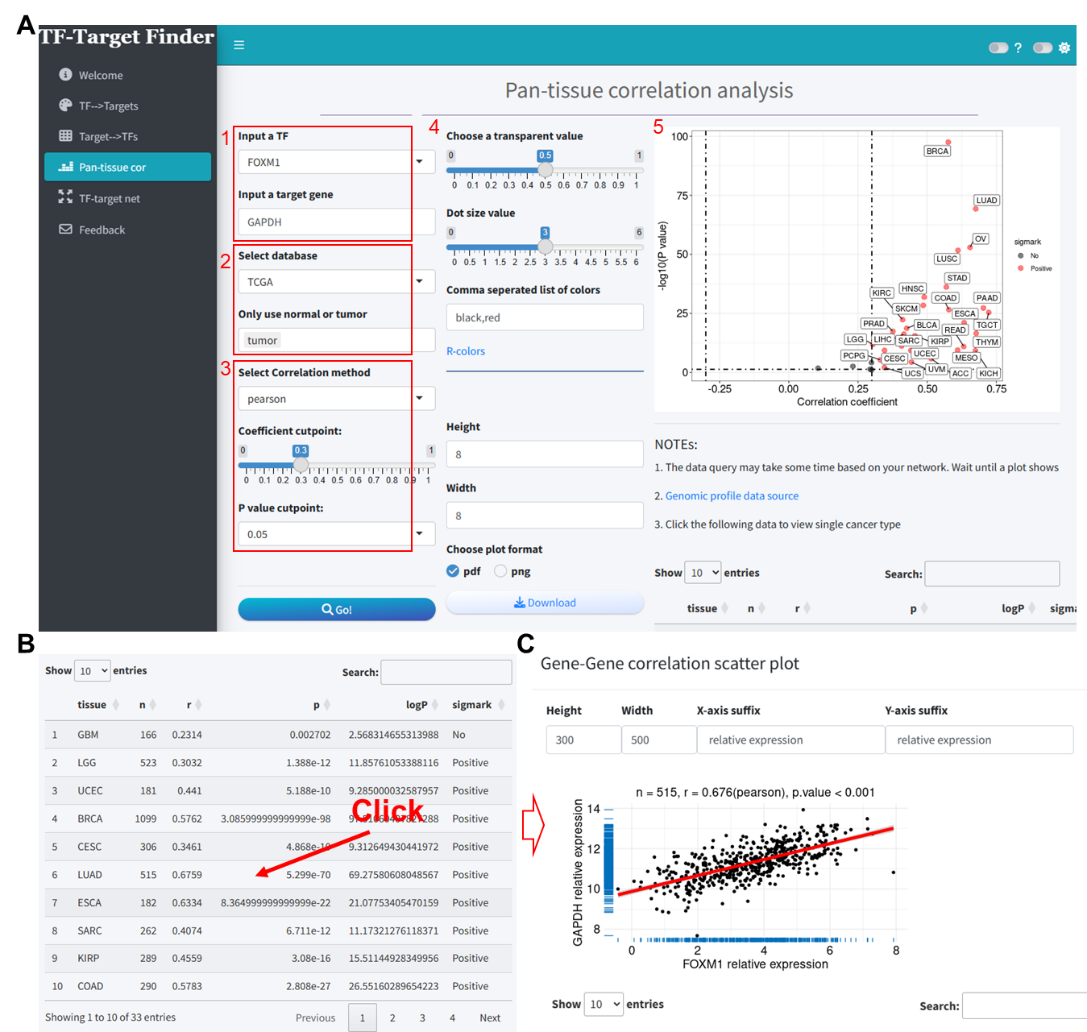
Figure 3. Correlation analysis of FOXM1 and GAPDH expression in TCGA pan-cancer samples using the TF-Target Finder Shiny app. (A-B) Parameter setting and display of predictive results; (C) Scatter plot illustrating the correlation between GAPDH and FOXM1 in the TCGA-LUAD dataset. TF, transcription factor. TCGA, The Cancer Genome Atlas. LUAD, lung adenocarcinoma.
Module 4: TF-targets regulation network analysis
The module was designed to predict the target genes of transcription factors (TFs) of interest based on gene differential expression analysis results uploaded by the user, utilizing multiple TF prediction databases, and to visualize the regulatory network. This module thus facilitates the elucidation of potential regulatory relationships by integrating user data with established TF prediction resources, supporting the discovery of novel insights into gene regulatory networks. The steps for utilizing this module are as follows:
- Data upload: Users upload their gene expression differential analysis results. It is important to ensure that the column names in the uploaded file are consistent with those in the example data provided.
- Differential gene selection criteria: Set the thresholds for selecting differentially expressed genes, specifically the log2 fold change (log2FC) and p-value.
- Tool selection: Choose the predictive tools to be included in the analysis for identifying TF-target gene relationships.
- TF List Update: Upon input completion, the ‘TF to analysis’ input field automatically updates with a list of TFs. This list is generated based on the intersection of differentially expressed genes from the uploaded results and the TFs contained within the chosen predictive tools.
- TF different expression result: The ‘TF result’ page will exhibit the differential analysis results of TFs extracted from the user’s uploaded data.
- Initiate Prediction Analysis: Clicking the ‘Go’ button starts the predictive analysis process.
- Network Visualization: After the analysis is complete, a network diagram is generated. Note that some TFs may not display target genes in the network diagram if no target genes are identified after intersecting the results from multiple tools. In such cases, it may be beneficial to reduce the number of tools included in the analysis to obtain more extensive information.
- Plotting Data Interface: The ‘Plotting data’ interface will present the predicted results for TF-target genes.
Taking the differential analysis results from the GSE17025 dataset as an instance (Supplementary file 4), we uploaded these results and set the thresholds for differentially expressed genes at log2FC = 1 and P value < 0.05. The TF results interface within the app then displays the differential analysis outcomes for all TFs extracted from the uploaded data (Figure 4A). In this analysis, we predicted TF target genes based on the hTFtarget and MotifMap tools. The TF to analysis dropdown was automatically updated with TFs included in these two databases, and we selected all for analysis. The network visualization resulting from the intersection of the predicted outcomes and differentially expressed genes is as illustrated in Figure 4B. The predictive outcomes and data for plotting can be viewed and downloaded in the Plotting data section (Figure 4C).
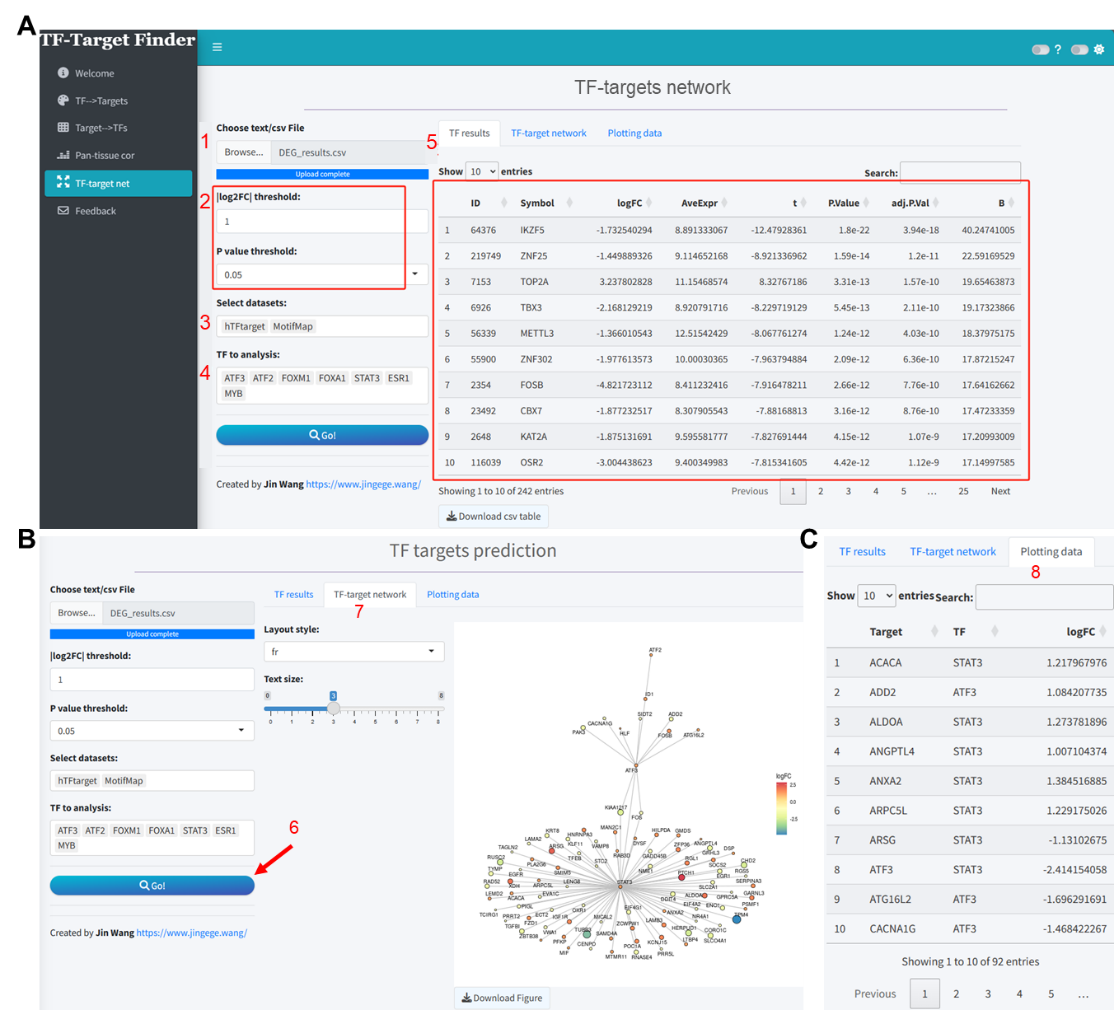
Figure 4. TF-targets regulation network analysis based on differential gene expression analysis results using the TF-Target Finder Shiny app. (A) Parameter setting and display of differential expression results for TFs extracted from uploaded data; (B) Visualization of the TF-targets regulation network; (C) Viewing and downloading prediction results in Plotting data tab. TF, transcription factor.
使用该小工具预测转录因子时,如果选择某些数据库,则会出现”Disconnected from the server”,需要reload,如果去掉一些数据库,才能显示出结果,请问有什么办法解决~
最好的办法就是安装本地R包,本地运行app,在线的有些数据比较大,访问容易断开
您好,在使用Pan-tissue correlation analysis分析关系的时候出现了error,无法显示分析的图,请问是什么原因呀?想请您看看是否能解决,谢谢您!
进哥好,APP一用就出现Disconnected from the server是怎么回事,谢谢!
大佬您好,我是 研一新生,有个问题想请教您,我们课题组目前研究成果是ADRA2A基因调控区等位基因突变点附近序列能够与某一核蛋白相结合来抑制基因表达,但这个蛋白量少且难以纯化,所以我想用您这个方法来预测这个转录因子可以么?或者说这个基因的突变位点是否会影响转录因子的预测?谢谢
一直进不去app唉
进哥,请问FIMO_JASPA、PWMEnrich_JASPAR这两个数据来源有什么不同吗
这个怎么引用?
APP下载入口进不去
网址好像打不开
网址好像打不开
进哥哥,您好,请问我使用靶基因预测转录因子,检索CCL2,但是只有CCL5,请问这是为什么?因为我看有文章里已知CCL2基因,预测了它的转录因子,ATF2。所以我想验证一下是否真的有ATF2。
无敌了 !感谢进哥哥
为什么总是自动选择所有数据库交集啊,删除也不行
请问可以做植物的转录因子靶基因预测吗?
王老师,您好,感谢您的知识共享,受益匪浅。在使用APP进行TF靶基因预测时,只有hTFTarget的预测靶基因list,请问可以获取其他物种的预测基因集么?第二个疑问:上传自己的DEGs进行TF-target net分析时,按照模版要求数据格式上传后网页提示没有可用data,请问进一步怎么解决?期待您的回复。