
Shiny 概览
- Shiny 用户界面可以用纯 R 语言构建,仅用几行代码就可以构建 web 应用程序 。
- 基于Twitter Bootstrap的默认UI主题美观实用。
- 可以轻松部署自己的 Shiny 小工具。
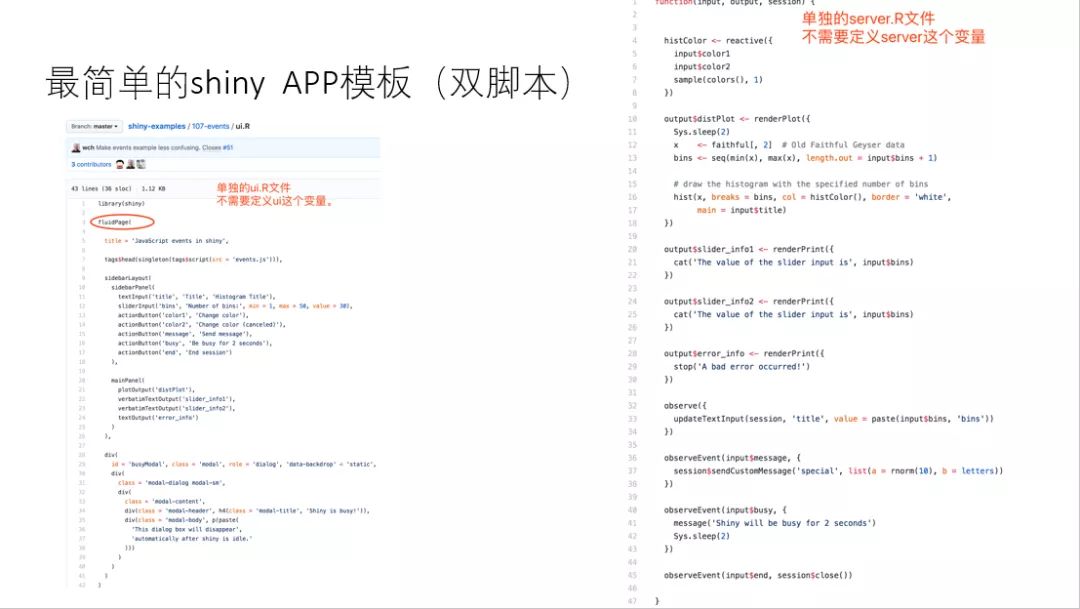
Shiny应用程序分为两个部分:用户界面定义和服务端脚本。可以由单个脚本构成,也可以分为双脚本 ui.R 和 server.R。
-
单脚本

-
双脚本
UI
我学习模仿的网站是 https://aarongowins.shinyapps.io/PubMedSearch/ 主要功能就是对感兴趣的关键词进行 PubMed 文本挖掘,界面如下:(套用了 shinydashboard 的UI界面)
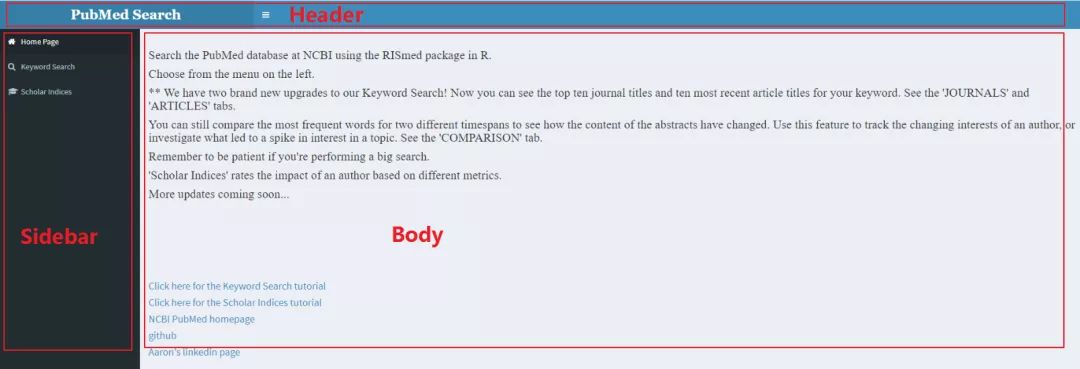
可见 dashboard 布局分为三个部分header,sidebar 和 body:
dashboardPage(
  dashboardHeader(),
  dashboardSidebar(),
  dashboardBody()
)
对于复杂一些的布局这样写可以更加清晰易读:
header <- dashboardHeader()
sidebar <- dashboardSidebar()
body <- dashboardBody()

dashboardPage(header, sidebar, body)
Header
所谓 Header 可以包括标题和下拉菜单,就像这样:

设置这个标题只需要修改 title 参数即可:
dashboardHeader(title = "My Dashboard")
其他的一些下拉菜单由函数生成。菜单有三种类型,包括消息,通知和任务。因为这个网页上没有下拉菜单这些小东西,我还没怎么看,需要的时候再看咯~
所以 Header 部分就是简单的一行:
dashboardHeader(title = "PubMed Search"),
Sidebar
侧边栏通常用于快速导航。它可以包含菜单项,以及一些 Shiny 输入,如滑块和文本输入。当点击侧边栏的菜单项,就可以在 Body 中显示不同的内容。
需要注意的是,当设置多个菜单项时,需要将这些 menuItem 的名称与 tabItem 相对应:
## ui.R ##
sidebar <- dashboardSidebar(
  sidebarMenu(
    menuItem("Dashboard", tabName = "dashboard", icon = icon("dashboard")),
    menuItem("Widgets", icon = icon("th"), tabName = "widgets",
             badgeLabel = "new", badgeColor = "green")
  )
)

body <- dashboardBody(
  tabItems(
    tabItem(tabName = "dashboard",
      h2("Dashboard tab content")
    ),

    tabItem(tabName = "widgets",
      h2("Widgets tab content")
    )
  )
)

# Put them together into a dashboardPage
dashboardPage(
  dashboardHeader(title = "Simple tabs"),
  sidebar,
  body
)
menuItem 还可以设置图标,这些图标来自 Font-Awesome 和 Glyphicons :
- http://fontawesome.io/icons/
- http://getbootstrap.com/components/#glyphicons
所以 PubMed Search 的侧边栏就可以这样写:
dashboardSidebar(
    menuItem("Home Page", tabName = "home_page", icon = icon("home")),
    menuItem("Keyword Search", tabName = "search", icon = icon("search"))
  ),

dashboardBody(
  tabItems(
    tabItem(tabName = "home_page"),
    tabItem(tabName = "search")
  )
)
Body
dashboard 主体部分可以包含任何常规的 Shiny 内容。

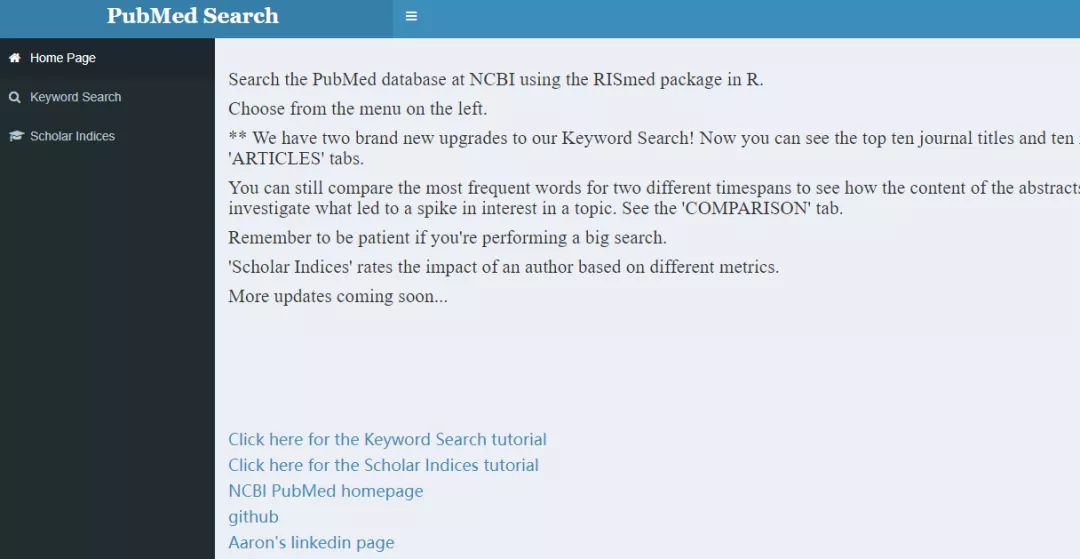
第一个 Home Page 菜单栏包括了一段简要的概述,我就简单粗暴地把每句话都放在四级标题h4()里了:
h4("Search the PubMed database at NCBI using the RISmed package in R."),
              h4("Choose from the menu on the left."),
              h4("** We have two brand new upgrades to our Keyword Search! Now you can see the top ten journal titles and ten most recent article titles for your keyword. See the 'JOURNALS' and 'ARTICLES' tabs."),
              h4("You can still compare the most frequent words for two different timespans to see how the content of the abstracts have changed. Use this feature to track the changing interests of an author, or investigate what led to a spike in interest in a topic. See the 'COMPARISON' tab."),
              h4("Remember to be patient if you're performing a big search."),
              h4("'Scholar Indices' rates the impact of an author based on different metrics."),
              h4("More updates coming soon...")
而第二个 Keyword Search 菜单栏,有好几个分栏,我用了 tabPanel 来创建这些内容。
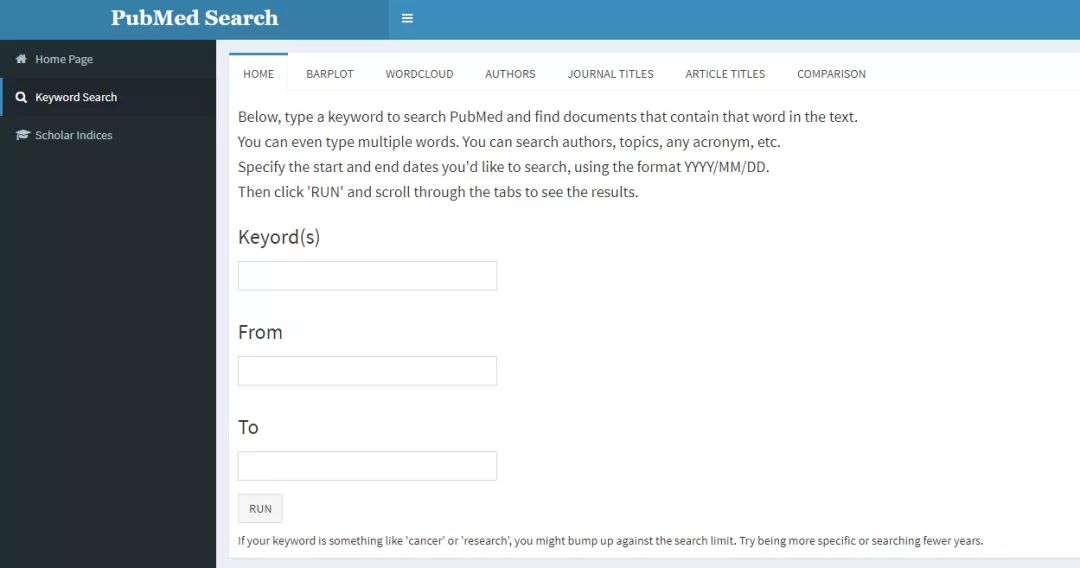
tabItem(tabName = "search",
              tabsetPanel(
                tabPanel("HOME"),
                tabPanel("BARPLOT"),
                tabPanel("WORDCLOUD"),
                tabPanel("AUTHORS"),
                tabPanel("JOURNAL TITLES"),
                tabPanel("ARTICLE TITLES"),
                tabPanel("DOWNLOAD")
              )
      )
用户界面和服务端的交互是通过交互式控件来进行交互:
例如,在ui.R中使用 textInput()进行文字的输入,例如 textInput('keyword','Keyword(s)', value='lncRNA'), ,其中第一个参数是名称,第二个参数是显示的标签,第三个参数是默认数值。在server.R中,Shiny 使用 input 对象的组件来访问输入,并通过向 output 对象的组件赋值来生成输出。
使用 actionButton() 和服务器端的 observeEvent()使整个得到结果的过程只有在点击按钮后才能更新输出,actionButton() 实际上是创建了一个最初为零的操作按钮,并在每次按下时递增一,一旦这个值发生改变即可执行表达式。
交互式控件
因为从 PubMed 获取数据的时间比较长,我用了 shinycssloaders 包,来生成缓冲动画:
plotOutput("my_plot") %>% withSpinner()
Body 部分代码如下:
dashboardBody(
    tabItems(
      # First tab content
      tabItem(tabName = "home_page",
              h4("Search the PubMed database at NCBI using the RISmed package in R."),
              h4("Choose from the menu on the left."),
              h4("** We have two brand new upgrades to our Keyword Search! Now you can see the top ten journal titles and ten most recent article titles for your keyword. See the 'JOURNALS' and 'ARTICLES' tabs."),
              h4("You can still compare the most frequent words for two different timespans to see how the content of the abstracts have changed. Use this feature to track the changing interests of an author, or investigate what led to a spike in interest in a topic. See the 'COMPARISON' tab."),
              h4("Remember to be patient if you're performing a big search."),
              h4("'Scholar Indices' rates the impact of an author based on different metrics."),
              h4("More updates coming soon...")
      ),

      # Second tab content
      tabItem(tabName = "search",
              tabsetPanel(
                tabPanel("HOME",
                         h4("Below, type a keyword to search PubMed and find documents that contain that word in the text."),
                         h4("You can even type multiple words. You can search authors, topics, any acronym, etc."),
                         h4("Specify the start and end dates you'd like to search, using the format YYYY."),
                         h4("Then click 'RUN' and scroll through the tabs to see the results."),
                         textInput('keyword','Keyword(s)', value='lncRNA'),
                         textInput('from','From', value='2013'),
                         textInput('to','To', value='2018'),
                         actionButton("do", "RUN", icon("paper-plane"), style="color: #fff; background-color: #337ab7; border-color: #2e6da4"),
                         helpText("If your keyword is something like 'cancer' or 'research', you might bump up against the search limit. Try being more specific or searching fewer years."),
                         textOutput("summary")  %>% withSpinner(),
                         DT::dataTableOutput('result_table') %>% withSpinner()
                         ),
                tabPanel("BARPLOT",
                         h4("A barplot of publications containing your keyword per year."),
                         plotlyOutput("barPlot")  %>% withSpinner()
                         ),
                tabPanel("WORDCLOUD",
                         h4("A wordcloud of the abstracts for your keyword."),
                         wordcloud2Output("my_wc", width = "100%", height = "400px") %>% withSpinner()
                         ),
                tabPanel("AUTHORS",
                         h4("A table of authors with publicatons containing your keyword."),
                         DT::dataTableOutput('author_table') %>% withSpinner()),
                tabPanel("JOURNAL TITLES",
                         h4("A table of journal titles of publicatons containing your keyword."),
                         DT::dataTableOutput('journal_table') %>% withSpinner()),
                tabPanel("ARTICLE TITLES",
                         h4("A table of recent article titles of publicatons containing your keyword."),
                         wordcloud2Output("my_wc2", width = "100%", height = "400px")%>% withSpinner()),
                tabPanel("DOWNLOAD",
                         h4("Download the csv file."),
                         downloadButton('downloadData', 'Download'))
              )
      )
    )
  )
)
Theme
我用了dashboardthemes包(https://github.com/nik01010/dashboardthemes )来美化一下 UI:
library(devtools)
install_github("nik01010/dashboardthemes")
使用主题只需在 Body 部分的代码中插入shinyDashboardThemes(theme = "blue_gradient")即可:
  ...
  ### ui body
  dashboardBody(

    ### changing theme
    shinyDashboardThemes(
      theme = "blue_gradient"
    )

    ### ui tabs
    ,tabItems(
      tabItem(
        ...
Server
如何获取 PubMed 数据
RISmed 包可以查询 PubMed 数据库中的信息。
简单介绍 EUtilsSummary
通过 EUtilsSummary 就可以很方便地检索 PubMed 数据库:
library(RISmed)
res <- EUtilsSummary("pinkeye", type="esearch", db="pubmed", datetype='pdat', mindate=2000, maxdate=2015, retmax=500)
用 QueryCount(res) 可以来查看搜索到几条记录。
简单介绍 EUtilsGet
通过调用 EUtilsGet() 来访问检索到的数据。例如,使用 ArticleTitle() 创建一个包含所有文章标题的字符向量 t :
t<-ArticleTitle(EUtilsGet(res))

typeof(t)
"character"

head(t,1)
"Infectious bovine keratoconjunctivitis (pinkeye)."

t[2]
"Moraxella spp. isolated from field outbreaks of infectious bovine keratoconjunctivitis: a retrospective study of case submissions from 2010 to 2013."
res 也包含了大量与日期相关的数据。例如,可以得到文章发表的时间,或被 PubMed 数据库接收的时间:
y <- YearPubmed(EUtilsGet(res))
r <- YearReceived(EUtilsGet(res))

y
2015 2014 2013 2012 2011 2011 2011 2010 2010 2010 2010 2008 2008 2008 2008 2007 2007 2007 2007 2006 2005 2004 2002

r
NA   NA 2012 2012 2011 2011   NA 2010   NA   NA   NA   NA 2008 2007   NA 2007 2007 2007   NA   NA 2004   NA   NA
YearPubmed看起来NA较少。
接着,对这些数据进行简单的可视化:
library(ggplot)
date()
count<-table(y)
count<-as.data.frame(count)
names(count)<-c("Year", "Counts")
num <- data.frame(Year=count$Year, Counts=cumsum(count$Counts))
num$g <- "g"
names(num) <- c("Year", "Counts", "g")
q <- qplot(x=Year, y=Counts, data=count, geom="bar", stat="identity")
q <- q + ggtitle(paste("PubMed articles containing '", g,            "' ", "= ", max(num$Counts), sep="")) +
     ylab("Number of articles") +
     xlab(paste("Year n Query date: ", Sys.time(), sep="")) +
     labs(colour="") +
     theme_bw()
q
## 因为在网页上显示,我后来就直接用了 plotly
文本挖掘
下面的例子是以年为参数,返回这一年摘要中最常见的 20 个单词:
library(qdap)
myFunc<-function(argument){
articles1<-data.frame('Abstract'=AbstractText(fetch), 'Year'=YearPubmed(fetch))
abstracts1<-articles1[which(articles1$Year==argument),]
abstracts1<-data.frame(abstracts1)
abstractsOnly<-as.character(abstracts1$Abstract)
abstractsOnly<-paste(abstractsOnly, sep="", collapse="")
abstractsOnly<-as.vector(abstractsOnly)
abstractsOnly<-strip(abstractsOnly)
stsp<-rm_stopwords(abstractsOnly, stopwords = qdapDictionaries::Top100Words)
ord<-as.data.frame(table(stsp))
ord<-ord[order(ord$Freq, decreasing=TRUE),]
head(ord,20)
}

oSix<-myFunc(2006)
oSeven<-myFunc(2007)
all<-cbind(oSix, oSeven)
names(all)<-c("2006","freq","2007","freq")

all
                   2006 freq          2007 freq
10               bovine    6         bovis   12
38           infectious    6        calves   11
42 keratoconjunctivitis    6             m    8
60                  qtl    4           ibk    7
14          centimorgan    3     moraxella    7
24                    f    3       vaccine    6
32             hereford    3       control    5
50            offspring    3     cytotoxin    5
2                  also    2      isolates    5
4                 angus    2       pinkeye    5
5               animals    2   recombinant    5
13               cattle    2             s    5
16           chromosome    2      analysis    4
17                 cows    2    associated    4
20              disease    2             b    4
22             evidence    2      efficacy    4
27           fstatistic    2          gene    4
31                group    2          mbxa    4
33           identified    2 phospholipase    4
41             interval    2     pilinmbxa    4
还可以看看关于这个领域发文章比较多的研究人员:
auths<-Author(EUtilsGet(res))
typeof(auths)
"list"

auths[3]
   LastName  ForeName Initials order
1 Kizilkaya     Kadir        K     1
2      Tait Richard G       RG     2
3   Garrick  Dorian J       DJ     3
4  Fernando   Rohan L       RL     4
5     Reecy   James M       JM     5

Last<-sapply(auths, function(x)paste(x$LastName))
auths2<-as.data.frame(sort(table(unlist(Last)), dec=TRUE))
names(auths2)<-c("name")

head(auths2)
         name
Angelos     5
Ball        3
O'Connor    3
Reecy       3
Tait        3
Casas       2
服务器端代码
首先需要定义一些全局变量:
  glob_values <- reactiveValues(
    search_query=NULL,
    records=NULL,
    pubmed_data=NULL,
    count=NULL,
    ord=NULL,
    auths_table=NULL,
    title=NULL,
    journal_table=NULL)
  reactiveValues.reset <-function(){
    search_query=NULL
    records=NULL
    pubmed_data=NULL
    count=NULL
    ord=NULL
    auths_table=NULL
    title=NULL
    journal_table=NULL
  }
接下来就是 observeEvent(input$do,{}) 控制这些连锁反应,最后是各种输出。
用 plotly 包生成可交互的动态图, DT包可使表格更直观地展示, wordcloud2 包来生成词云:
  output$barPlot <- renderPlotly(
    if (! is.null(glob_values$count)){
      plot_ly(glob_values$count, x =~Year, y =~Counts, fillcolor=~Year)
    }
  )
  output$my_wc<-renderWordcloud2(
    if (! is.null(glob_values$ord)){
      wordcloud2(glob_values$ord, size = 2, minRotation = -pi/6, maxRotation = -pi/6,
                 rotateRatio = 1)})
  output$journal_table <- DT::renderDataTable({if (!is.null(glob_values$journal_table))glob_values$journal_table},
                                             rownames= FALSE,options = list(
                                               pageLength = 10,
                                               lengthMenu = list(c(10, 50, 100,-1), c('10', '50','100', 'All')),
                                               scrollX = TRUE,
                                               fixedHeader = TRUE,
                                               fixedColumns = TRUE ,
                                               deferRender = TRUE
                                             ),
                                             escape = FALSE
  )
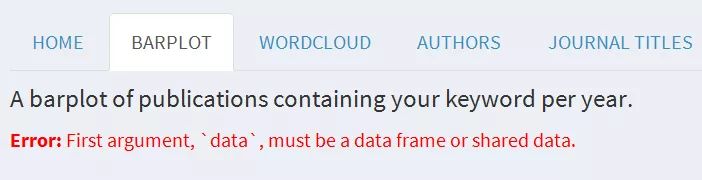
在生成 output 时,最好加上判定:
  output$barPlot <- renderPlotly(
    if (! is.null(glob_values$count)){
      plot_ly(glob_values$count, x =~Year, y =~Counts, fillcolor=~Year)
    }
  )
要是不加判定,没有第一个值产生,就会导致输出错误:
server.R 代码如下:
#
# This is the server logic of a Shiny web application. You can run the
# application by clicking 'Run App' above.
#
# Find out more about building applications with Shiny here:
#
#    http://shiny.rstudio.com/
#

library(shiny)
library(shinydashboard)
library(RISmed)
library(plotly)
library(qdap)
library(wordcloud2)
library(shinycssloaders)

function(input, output) {
  glob_values <- reactiveValues(
    search_query=NULL,
    records=NULL,
    pubmed_data=NULL,
    count=NULL,
    ord=NULL,
    auths_table=NULL,
    title=NULL,
    journal_table=NULL)
  reactiveValues.reset <-function(){
    search_query=NULL
    records=NULL
    pubmed_data=NULL
    count=NULL
    ord=NULL
    auths_table=NULL
    title=NULL
    journal_table=NULL
  }
  observeEvent(input$do,{
    reactiveValues.reset()
    glob_values$search_query <- EUtilsSummary(c(input$keyword),
                                              db="pubmed",
                                              retmax=500,
                                              datetype='pdat',
                                              mindate=input$from,
                                              maxdate=input$to)

    glob_values$records<- EUtilsGet(glob_values$search_query)
    glob_values$pubmed_data <- data.frame('Title'=ArticleTitle(glob_values$records),
                 'Year'=YearAccepted(glob_values$records),
                 'Journal'=ISOAbbreviation(glob_values$records),
                 'Abstract'=AbstractText(glob_values$records))
    glob_values$count <- as.data.frame(table(YearPubmed(EUtilsGet(glob_values$search_query))))
    names(glob_values$count) <-c ("Year", "Counts")

    abstractsOnly<-as.character(glob_values$pubmed_data$Abstract)
    abstractsOnly<-paste(abstractsOnly, sep="", collapse="")
    abstractsOnly<-as.vector(abstractsOnly)
    abstractsOnly<-strip(abstractsOnly)
    stsp<-rm_stopwords(abstractsOnly, stopwords = qdapDictionaries::Top100Words)
    glob_values$ord<-as.data.frame(table(stsp))
    glob_values$ord<-glob_values$ord[order(glob_values$ord$Freq, decreasing=TRUE),]

    auths<-Author(glob_values$records)
    Last<-sapply(auths, function(x)paste(x$LastName))
    Fore<-sapply(auths, function(x)paste(x$ForeName))
    name <- paste(unlist(Fore), unlist(Last), sep = " ")
    auths2<-as.data.frame(sort(table(unlist(name)), dec=TRUE))
    auths2 <- as.data.frame(auths2)
    colnames(auths2) <- c("Author","Freq")
    glob_values$auths_table <- auths2

    TitleOnly<-as.character(glob_values$pubmed_data$Title)
    TitleOnly<-paste(TitleOnly, sep="", collapse="")
    TitleOnly<-as.vector(TitleOnly)
    TitleOnly<-strip(TitleOnly)
    sts<-rm_stopwords(TitleOnly, stopwords = qdapDictionaries::Top100Words)
    glob_values$title<-as.data.frame(table(sts))
    glob_values$title<-glob_values$title[order(glob_values$title$Freq, decreasing=TRUE),]

    journalsOnly <- glob_values$pubmed_data$Journal
    glob_values$journal_table <- as.data.frame(sort(table(unlist(journalsOnly)), dec=TRUE))
  })

  output$summary <- renderText({
    recount <- attr(glob_values$search_query,"count")
    paste("We found", recount, "records.")
  })

  output$barPlot <- renderPlotly(
    if (! is.null(glob_values$count)){
      plot_ly(glob_values$count, x =~Year, y =~Counts, fillcolor=~Year)
    }
  )

  output$my_wc<-renderWordcloud2(
    if (! is.null(glob_values$ord)){
      wordcloud2(glob_values$ord, size = 2, minRotation = -pi/6, maxRotation = -pi/6,
                 rotateRatio = 1)})

  output$author_table <- DT::renderDataTable({if (! is.null(glob_values$auths_table))glob_values$auths_table},
                                             rownames= FALSE,options = list(
    pageLength = 10,
    lengthMenu = list(c(10, 50, 100,-1), c('10', '50','100', 'All')),
    scrollX = TRUE,
    fixedHeader = TRUE,
    fixedColumns = TRUE ,
    deferRender = TRUE
  ),
  escape = FALSE
  )

  output$my_wc2<-renderWordcloud2(if (! is.null(glob_values$title)){
    wordcloud2(glob_values$title, size = 2, minRotation = -pi/6, maxRotation = -pi/6,
                                            rotateRatio = 1)})

  output$journal_table <- DT::renderDataTable({if (!is.null(glob_values$journal_table))glob_values$journal_table},
                                             rownames= FALSE,options = list(
                                               pageLength = 10,
                                               lengthMenu = list(c(10, 50, 100,-1), c('10', '50','100', 'All')),
                                               scrollX = TRUE,
                                               fixedHeader = TRUE,
                                               fixedColumns = TRUE ,
                                               deferRender = TRUE
                                             ),
                                             escape = FALSE
  )

  output$downloadData <- downloadHandler(
    filename = function(){paste(input$keyword, '.csv', sep='')},
    content = function(file) {
      write.csv(glob_values$pubmed_data, file)
    }
  )

  output$result_table <- DT::renderDataTable({if (!is.null(glob_values$pubmed_data))glob_values$pubmed_data},
                                              rownames= FALSE,options = list(
                                                pageLength = 10,
                                                lengthMenu = list(c(10, 50, 100,-1), c('10', '50','100', 'All')),
                                                scrollX = TRUE,
                                                fixedHeader = TRUE,
                                                fixedColumns = TRUE ,
                                                deferRender = TRUE
                                              ),
                                              escape = FALSE
  )
}
踩过的坑
使用submitButton控件可以实现当用户点击按钮后才更新输出,一开始我就按照示例这么写( http://shiny.rstudio.com/gallery/submitbutton-demo.html )因为他没有加上reactive 所以我也没加,这样就导致每次输入都无法更新输出。当时都不知道自己错在哪了,多亏了健明大大帮我看了看代码,原来示例中的render本身就包含reactive的属性,所以就不用reactive了。
在server.R中除了可以使用observeEvent外,还可以用eventReactive,区别在于observeEvent无返回值,eventReactive有返回值。
search_query <- eventReactive(input$do, {input$keyword})
我写完了才发现首页(https://aarongowins.shinyapps.io/PubMedSearch/)就有作者的 GitHub 网址。。。看了下作者的代码,他每个输出都要从 PubMed 获取重复的内容,本来速度就慢,他重复七次就更慢了,而且还没有缓冲动画,这样就导致点了RUN就和没点一样,很影响交互。除此之外,其实后期还可以加上其他的一些功能和可视化,比如结合scholar包,加入影响因子等信息。
Reference
- http://yanping.me/shiny-tutorial/#welcome
- http://rstudio.github.io/shiny/tutorial/
- https://rstudio.github.io/shinydashboard/structure.html
- 生信技能树 – KEGG富集分析从未如此简单
- https://www.r-bloggers.com/how-to-search-pubmed-with-rismed-package-in-r/
- http://shiny.rstudio.com/articles/reactivity-overview.html
- https://segmentfault.com/a/1190000009775258
- https://plot.ly/r/