R语言中的ggplot2包里面的风格固定,在需要特殊的图形时,需要更改甚至自定义设置主题。本文展示ggplot2包里的八种默认的主题,并介绍扩展包ggthemes去自定义主题内容。
八种主题函数汇总表
|
主题函数 |
效果 |
|
theme_bw() |
网格白色主题 |
|
theme_classic() |
经典主题 |
|
theme_dark() |
暗色主题,可用于对比 |
|
theme_gray() |
默认主题 |
|
theme_light() |
浅色坐标带网格 |
|
theme_linedraw() |
黑色网格线 |
|
theme_minimal() |
极简主题 |
|
theme_void() |
空白主题 |
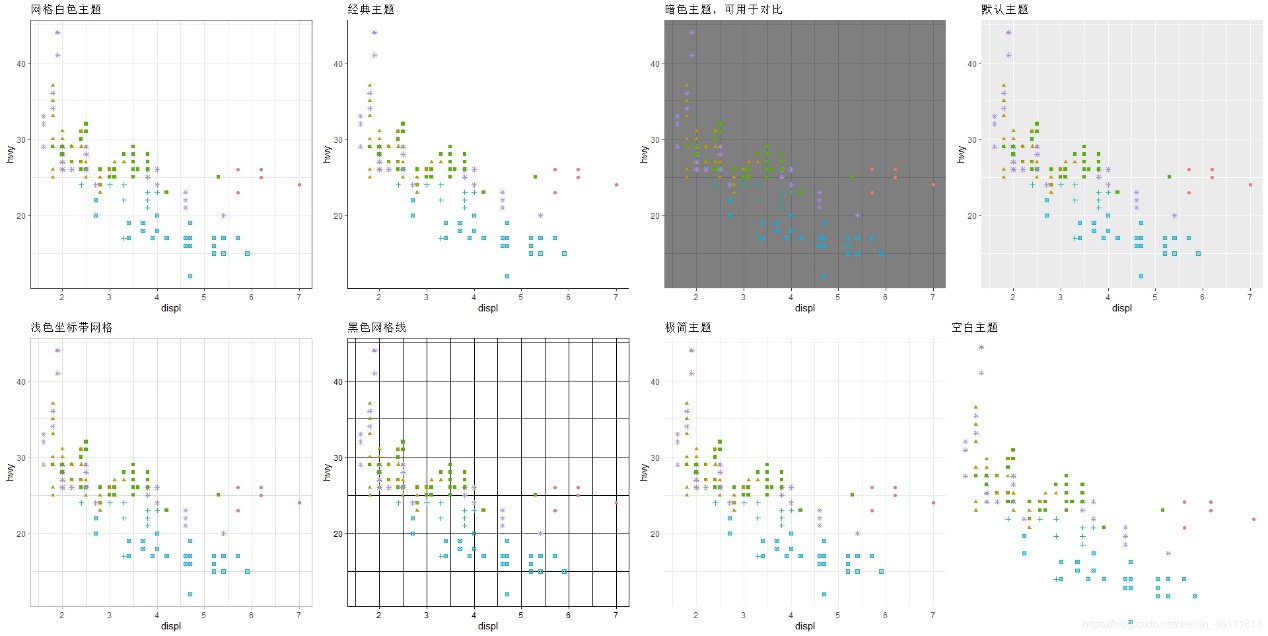
主题汇总图
代码:
p1 <- ggplot(data = mpg) +

geom_point(mapping = aes(x = displ, y = hwy, col = class, shape = class)) +

theme_bw() +

labs(title = "网格白色主题")+ theme(legend.position = "none")

p2 <- ggplot(data = mpg) +

geom_point(mapping = aes(x = displ, y = hwy, col = class, shape = class)) +

theme_classic() +

labs(title = "经典主题")+ theme(legend.position = "none")

p3 <- ggplot(data = mpg) +

geom_point(mapping = aes(x = displ, y = hwy, col = class, shape = class)) +

theme_dark() +

labs(title = "暗色主题,可用于对比")+ theme(legend.position = "none")

p4 <- ggplot(data = mpg) +

geom_point(mapping = aes(x = displ, y = hwy, col = class, shape = class)) +

theme_gray() +

labs(title = "默认主题")+ theme(legend.position = "none")

p5 <- ggplot(data = mpg) +

geom_point(mapping = aes(x = displ, y = hwy, col = class, shape = class)) +

theme_light() +

labs(title = "浅色坐标带网格")+ theme(legend.position = "none")

p6 <- ggplot(data = mpg) +

geom_point(mapping = aes(x = displ, y = hwy, col = class, shape = class)) +

theme_linedraw() +

labs(title = "黑色网格线")+ theme(legend.position = "none")

p7 <- ggplot(data = mpg) +

geom_point(mapping = aes(x = displ, y = hwy, col = class, shape = class)) +

theme_minimal() +

labs(title = "极简主题")+ theme(legend.position = "none")

p8 <- ggplot(data = mpg) +

geom_point(mapping = aes(x = displ, y = hwy, col = class, shape = class)) +

theme_void() +

labs(title = "空白主题")+ theme(legend.position = "none")

grid.arrange(p1,p2,p3,p4,p5,p6,p7,p8, nrow=2)
自定义主题:
theme_wj <- function(..., bg='white'){

require(grid)

theme_bw(...) +

theme(rect=element_rect(fill=bg),

plot.margin=unit(rep(0.5,4), 'lines'),

panel.background=element_rect(fill='transparent', color='transparent'),

panel.border=element_rect(fill='transparent', color='black',size = 1.6),

# panel.grid=element_blank(),

axis.title = element_text(color='black', vjust=0.1),

axis.ticks.length = unit(-0.3,"lines"),

axis.title.x =element_text(size=14, color="black" ),

axis.title.y=element_text(size=14, color="black"),

axis.text.x = element_text(size=14, color="black" ),

axis.text.y=element_text(size=14, color="black"),

axis.ticks = element_line(colour = "grey20"),

legend.title=element_blank(),

legend.key=element_rect(fill='transparent', color='transparent'))


}

P9 <- ggplot(data = mpg) +

geom_point(mapping = aes(x = displ, y = hwy, col = class, shape = class)) +

theme_wj() +

labs(title = "自定义主题")+ theme(legend.position = "none")
扩展包
如果感觉上面的主题话没有你满意的可以去加载ggthemes包,里面会有更加个性化的参数,创作出你想要的主题。