最近有需求绘制特定基因的转录本结构,上网查了相关教程,本来想找R语言的,无奈没找到合适的,以下为python版本的。特此分享
根据基因组注释文件gtf绘制基因全部转录本的结构图,利用python进行实现,并实现了GUI
可以下载各种gtf,从NCBI,ENSEMBL,UCSC,GENCODE都可以,但是要根据相应的版本修改代码
重点是得到所有基因的转录本个数,以及每个转录本的外显子的坐标。
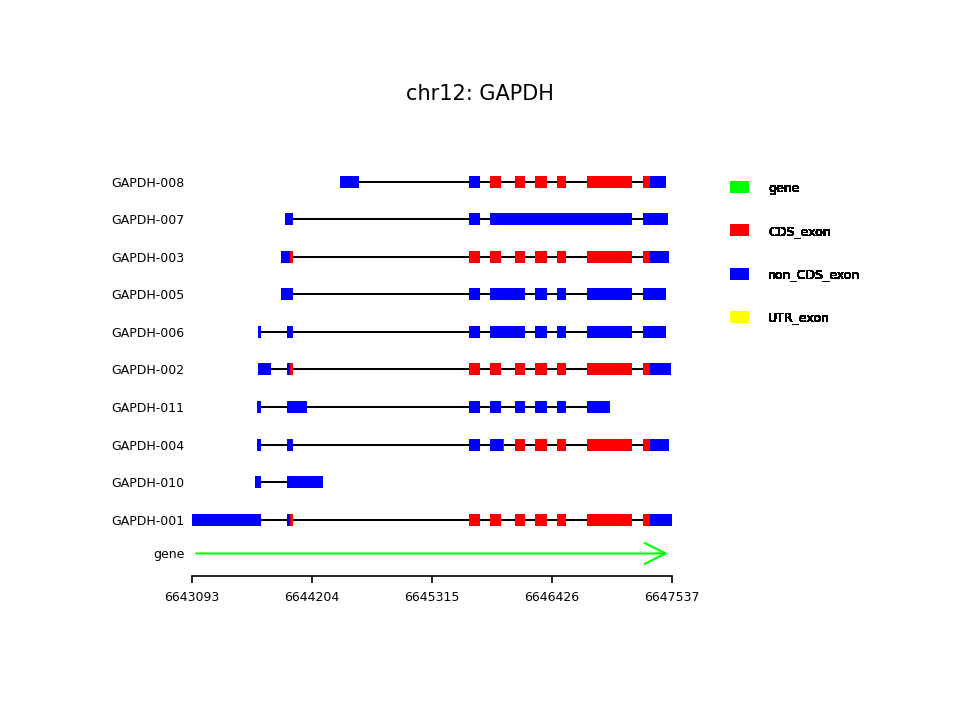
先上效果图,这是人类基因组中的GAPDH基因的全部转录本
下面直接上代码
#!/usr/bin/env python
#  coding:utf-8
import re
import os
import os.path
import numpy as np
import matplotlib.patches as mpatches
import matplotlib.pyplot as plt
import matplotlib.lines as lines
from tkinter import *
from tkinter import ttk
import time
import imageio
import shutil


class showGene(object):
    def __init__(self):

        list = os.listdir(os.getcwd())  # 列出文件夹下所有的目录与文件
        list2 = []
        for i in range(0, len(list)):
            if list[i][-4:-1] + list[i][-1] == '.gtf':
                list2.append(list[i])
        #选择基因组以及要显示的基因的GUI界面
        self.top = Tk()
        self.genename = StringVar()
        self.genedata = StringVar()
        self.getinfoFm = Frame(self.top)
        self.data = Label(self.getinfoFm, text="Chooes the gtf of a species").grid(column=0, row=0)  # 添加一个标签,并将其列设置为1,行设置为0
        self.gene = Label(self.getinfoFm, text="       Enter a genename:").grid(column=1, row=0)
        self.choosedata = ttk.Combobox(self.getinfoFm, width = 15, textvariable=self.genedata)
        self.choosedata['values'] = [''] + list2
        self.choosedata.current(0)
        self.choosedata.grid(column = 0, row = 1)
        self.genenameEntry = Entry(self.getinfoFm, textvariable=self.genename, width=12, )
        self.genenameEntry.grid(column = 1, row = 1)
        self.getinfoFm.pack()
        #按钮界面
        self.buttonFm = Frame(self.top)
        self.showB = Button(self.buttonFm, text = 'SHOW', command = self.show,
            activeforeground = 'white',
            activebackground = 'blue').grid(column = 0, row = 0)
        self.quitB = Button(self.buttonFm, text = 'QUIT', command = self.top.quit,
            activeforeground = 'white',
            activebackground = 'blue').grid(column = 1, row = 0)
        self.buttonFm.pack()

    def show(self):
        global genetxt_path
        transcript_num = 0
        gene_exist = 0
        transcript_list = []
        line_width = 5
        if self.genedata.get() == '' or self.genename.get() == '':
            return

        #gtf文件路径,默认为可执行文件(exe)所在文件夹
        data_path = os.getcwd() + '/' + self.genedata.get()
        genename = self.genename.get()
        #储存各基因结果(txt文本和png图片)的文件夹
        result_path = os.getcwd() + '/My result/' + genename
        #若路径不存在,创造路径
        if not os.path.exists(result_path):
            os.makedirs(result_path)
        #临时文件(基因的信息)的路径
        genetxt_path = result_path + '/' + genename + '.txt'

        f = open(data_path, 'r')
        fp = open(genetxt_path, 'w')
        allLines = f.readlines()
        for eachLine in allLines:
            if not eachLine.startswith('#'):
                eachLine_list = eachLine.split('\t')
                name = re.search('gene_name "(.*?)";', eachLine_list[-1]).group(1)
                if name == genename:
                    gene_exist = 1
                    fp.write(eachLine)
                    if eachLine_list[2] == 'transcript':
                        transcript_num += 1
                        transcript_name = re.search('transcript_name "(.*?)";', eachLine_list[-1]).group(1)
                        if transcript_name not in transcript_list:
                            transcript_list.append(transcript_name)
        f.close()
        fp.close()
        #若gtf文件中不存在相应基因的信息,弹出提示
        if gene_exist == 0:
            self.failedFm = Frame(self.top)
            self.faillb = Label(self.failedFm, text="genename no exist,please check and retry").pack()
            self.failedFm.pack()
            self.top.update()
            time.sleep(3)
            self.genename.set('')
            self.failedFm.destroy()
            shutil.rmtree(result_path)
        #反之向下执行
        else:
            fig = plt.figure(1)
            num = 0
            tmp_colors = ['lime', 'red', 'blue', 'yellow', 'yellow', 'w']
            names_tmp_colors = ['gene', 'CDS', 'exon', 'three_prime_utr', 'five_prime_utr', 'stop_codon']
            colors_legend_name = ['gene', 'CDS_exon', 'non_CDS_exon', 'UTR_exon']
            color_dict = dict(zip(names_tmp_colors, tmp_colors))
            png_path = result_path + '/' + genename + '.png'
            #读取之前保存的包含基因信息的txt文件,若不存在,弹出警告信息
            fp = open(genetxt_path, 'r')
            allLines = fp.readlines()
            for eachLine in allLines:
                eachLine_list = eachLine.split('\t')
                if eachLine_list[2] == 'gene':
                    #判断方向
                    if eachLine_list[6] == '+':
                        arr = '->'
                    else:
                        arr = '<-'

                    ax = fig.add_axes([0.2, 0.2, 0.5, 0.6])
                    arrow = mpatches.FancyArrowPatch(
                        (int(eachLine_list[3]), 0.1),
                        (int(eachLine_list[4]), 0.1),
                        arrowstyle=arr,
                        mutation_scale=25, lw=1, color='lime', antialiased=True)
                    # 画箭头
                    ax.add_patch(arrow)
                    # 坐标轴标签
                    ax.set_xlim(int(eachLine_list[3]), int(eachLine_list[4]))
                    ax.set_ylim(-0.5, transcript_num + 1)
                    ax.set_xticks(np.linspace(int(eachLine_list[3]), int(eachLine_list[4]), 5))
                    ax.set_yticks([0.1] + list(range(1, transcript_num + 1)))
                    ax.set_yticklabels(['gene'] + transcript_list)
                    ax.set_xticklabels([str(j) for j in [int(i) for i in np.linspace
                        (int(eachLine_list[3]), int(eachLine_list[4]),5)]])
                    # 坐标轴显示
                    ax.spines['top'].set_visible(False)
                    ax.spines['left'].set_visible(False)
                    ax.spines['right'].set_visible(False)
                    ax.get_xaxis().tick_bottom()
                    ax.get_yaxis().tick_left()
                    ax.get_xaxis().set_tick_params(direction='out')
                    ax.tick_params(axis=u'y', which=u'both', length=0)  # 纵坐标刻度线不显示(length=0)
                    # 坐标轴字体大小
                    for tick in ax.xaxis.get_major_ticks():
                        tick.label.set_fontsize(6)
                    for tick in ax.yaxis.get_major_ticks():
                        tick.label.set_fontsize(6)


                elif eachLine_list[2] == 'transcript':
                    num = num + 1
                    line1 = [(int(eachLine_list[3]), num), (int(eachLine_list[4]), num)]
                    (line1_xs, line1_ys) = zip(*line1)
                    ax.add_line(lines.Line2D(line1_xs, line1_ys, linewidth=0.2,
                                            solid_capstyle='butt', solid_joinstyle='miter',
                                            antialiased=False, color='black'))

                elif eachLine_list[2] in color_dict.keys():
                    # 添加结构图
                    line2 = [(int(eachLine_list[3]) - 0.5, num), (int(eachLine_list[4]) + 0.5, num)]
                    (line2_xs, line2_ys) = zip(*line2)
                    ax.add_line(lines.Line2D(line2_xs, line2_ys,
                                            solid_capstyle='butt', solid_joinstyle='miter',
                                            linewidth=int(line_width), alpha=1,
                                            color=color_dict[eachLine_list[2]],
                                            antialiased=False))
                # 做图例
                # add_axes 是在一张图上指定特定区域作图,第一个数字为从左边%74处,下面20%处开始,宽20%,高60%区域作图
                ax_legend = fig.add_axes([0.76, 0.2, 0.2, 0.6])
                for i in range(len(colors_legend_name)):
                    line3 = [(0, (9 - i) * 0.1), (0.1, (9 - i) * 0.1)]
                    (line3_xs, line3_ys) = zip(*line3)
                    ax_legend.add_line(lines.Line2D(line3_xs, line3_ys, linewidth=5,
                                                    color=color_dict[names_tmp_colors[i]],
                                                    solid_capstyle='butt', solid_joinstyle='miter',
                                                    antialiased=False))
                    ax_legend.text(0.2, (8.9 - i) * 0.1, colors_legend_name[i], fontsize=6)
                    ax_legend.set_axis_off()
                fig.suptitle('\n\n\nchr' + str(eachLine_list[0]) + ': ' + genename, fontsize=10)
                # 保存图片
                fig.savefig(png_path, dpi=150)

            #显示图片
            self.img_gif = PhotoImage(file = png_path)
            self.label_img = Label(self.top, image=self.img_gif)
            self.clearB = Button(self.top, text = 'CLEAR', command = self.clear,
                                    activeforeground = 'white',
                                    activebackground = 'blue')
            self.clearB.pack()
            self.label_img.pack()


    def clear(self):
        global genetxt_path
        self.top.update()
        self.label_img.destroy()
        self.clearB.destroy()
        #删除保存基因信息的txt文件,只保留图片
        os.remove(genetxt_path)


def main():
    d = showGene()
    mainloop()

if __name__ == '__main__':
    main()
注意!
1. gtf文件可以自行下载,将解压生成的gtf文件放入软件所在文件夹即可
2.生成的图片会自动保存在软件所在文件夹的 My result 文件夹(软件自动生成)中