概念
通常我们对于biomarker的预测模型会用ROC曲线来评价其性能,但是对于一些生存资料数据的预测模型或者需要加入时间因素,则会使用时间依赖(time dependent)的ROC曲线
传统的ROC曲线分析方法认为个体的事件(疾病)状态和markers是随着时间的推移而固定的,但在临床流行病学研究中,疾病状态和markers都是随着时间的推移而变化的(即time-to-event outcomes)。早期无病的个体由于研究随访时间较长,可能较晚发病,而且其markers可能在随访期间较基线发生变化。如果使用传统的ROC会忽略疾病状态或markers的时间依赖性,此时用随时间变化的time-dependent ROC(时间相依ROC)比较合适。 来自—真实世界大数据分析系列|ROC曲线与Time-dependent ROC 曲线
time-dependent ROC曲线的原理与常规的ROC曲线比较类似,前者相比后者多了时间因素,以便我们可以根据不同时间节点绘制不同的ROC曲线
本质上ROC曲线可以根据灵敏度和特异度两个指标来绘制的,所以我们通过比较常规的ROC曲线和time-dependent的ROC曲线对于灵敏度和特异度的计算公式即可明白两者的差别了
公式可以参考真实世界大数据分析系列|ROC曲线与Time-dependent ROC 曲线和时间依赖性ROC曲线(一),虽然两者公式的表现形式不同,但是细想下,其实是同一个意思
上述说的是Cumulative case/dynamic control ROC,另外还有一种Incident case/dynamic control ROC(似乎不太常见),可参考:Time-dependent ROC for Survival Prediction Models in R
实现方式
对于R中time-dependent ROC的实现方式,我一般会用timeROC和survivalROC包,当然还有其他的包(听说。。未尝试过),如:tdROC, timereg, risksetROC和survAUC
timeROC包相比survivalROC包会多计算个AUC的置信区间
若数据是生存资料数据,那么还会有不同的处理删除(censoring)方式,如Kaplan-Meier(KM), Cox model以及NNE(Nearest Neighbor Estimation)等等
下面以survivalROC包的mayo数据为例,其中mayoscore5和mayoscore4是两个marker,ROC曲线的绘制则用timeROC包
library(timeROC)
library(survival)

data(mayo)

time_roc_res <- timeROC(
  T = mayo$time,
  delta = mayo$censor,
  marker = mayo$mayoscore5,
  cause = 1,
  weighting="marginal",
  times = c(3 * 365, 5 * 365, 10 * 365),
  ROC = TRUE,
  iid = TRUE
)
计算AUC值及其置信区间
> time_roc_res$AUC
   t=1095    t=1825    t=3650
0.8982790 0.9153621 0.8576153
查看AUC的95%置信区间
> confint(time_roc_res, level = 0.95)$CI_AUC
        2.5% 97.5%
t=1095 85.01 94.64
t=1825 87.42 95.65
t=3650 79.38 92.14
绘制time-dependent ROC曲线
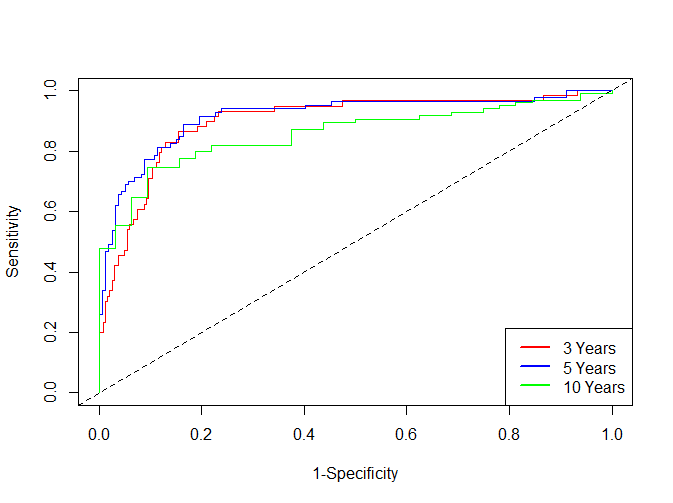
简单绘制下time-dependent ROC曲线(这里的plot函数对应的是timeROC::plot.ipcwsurvivalROC函数)
plot(time_roc_res, time=3 * 365, col = "red", title = FALSE)
plot(time_roc_res, time=5 * 365, add=TRUE, col="blue")
plot(time_roc_res, time=10 * 365, add=TRUE, col="green")
legend("bottomright",c("3 Years" ,"5 Years", "10 Years"),
       col=c("red", "blue", "green"), lty=1, lwd=2)
 time-
time-
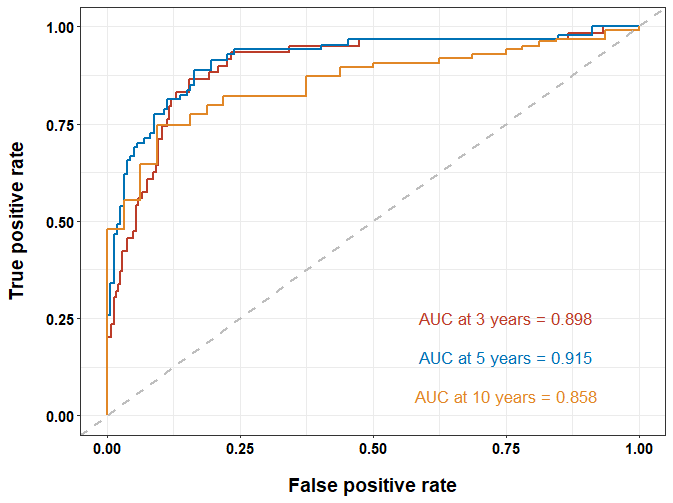
也可以通过修改在再美观点,如:
time_ROC_df <- data.frame(
  TP_3year = time_roc_res$TP[, 1],
  FP_3year = time_roc_res$FP[, 1],
  TP_5year = time_roc_res$TP[, 2],
  FP_5year = time_roc_res$FP[, 2],
  TP_10year = time_roc_res$TP[, 3],
  FP_10year = time_roc_res$FP[, 3]
)
library(ggplot2)
ggplot(data = time_ROC_df) +
  geom_line(aes(x = FP_3year, y = TP_3year), size = 1, color = "#BC3C29FF") +
  geom_line(aes(x = FP_5year, y = TP_5year), size = 1, color = "#0072B5FF") +
  geom_line(aes(x = FP_10year, y = TP_10year), size = 1, color = "#E18727FF") +
  geom_abline(slope = 1, intercept = 0, color = "grey", size = 1, linetype = 2) +
  theme_bw() +
  annotate("text",
           x = 0.75, y = 0.25, size = 4.5,
           label = paste0("AUC at 3 years = ", sprintf("%.3f", time_roc_res$AUC[[1]])), color = "#BC3C29FF"
  ) +
  annotate("text",
           x = 0.75, y = 0.15, size = 4.5,
           label = paste0("AUC at 5 years = ", sprintf("%.3f", time_roc_res$AUC[[2]])), color = "#0072B5FF"
  ) +
  annotate("text",
           x = 0.75, y = 0.05, size = 4.5,
           label = paste0("AUC at 10 years = ", sprintf("%.3f", time_roc_res$AUC[[3]])), color = "#E18727FF"
  ) +
  labs(x = "False positive rate", y = "True positive rate") +
  theme(
    axis.text = element_text(face = "bold", size = 11, color = "black"),
    axis.title.x = element_text(face = "bold", size = 14, color = "black", margin = margin(c(15, 0, 0, 0))),
    axis.title.y = element_text(face = "bold", size = 14, color = "black", margin = margin(c(0, 15, 0, 0)))
  )
请问老师,我画出了2年的dfs的ROC曲线,然后想找到该曲线的最佳截点值把我的数据二分类后绘制KM,这个截点值是可以找得到的吗
请问有算P值的代码吗
我理解的是一个模型里的多个指标
你好,进哥哥,请问我按照一样的处理方法处理了3个数据集到了跑timeROC这一步,其中一个数据集提示Error in Mat_data_cont1[, c(“T”, “marker”)] :
incorrect number of dimensions,但是我的T和marker长度是一致的,也都是数值型,请问你知道这个问题该如何解决吗?
进哥,大数据跑这个内存溢出,跑的也很慢,这咋办
老师,您好,请问怎么求最佳cutoff呢?以及时间依赖ROC曲线可以联合多指标吗?
这个ROC曲线用的是连续变量,不存在cutoff,用来评估生存数据的
R做生存分析如何取最佳cutoff(截断)
没明白联合多个指标什么意思?
老师您好,我想问一下我画出来ROC曲线,一开始有一小部分在虚线下面,后面的部分又都在虚线的上面了,想问一下这样子画出来的ROC曲线是正确的吗
您好,可能存在这样的情况,这样的数据出来的结果不太好
您好,我是给验证集做ROC曲线的时候出现了这样子的情况,但是AUC值是0.7多,那出现这样子的情况是否代表训练集中构建的模型预后效果是不太好的呢
0.7多一点,看你的要求吧,如果验证集也满意 大于0.7 那就还行
你应该画的是1年的ROC吧 可以看看3/5年的是多少
好的,谢谢麻烦您啦
请问根据这个代码可以得出准确度和敏感性这些指标吗?
什么意思?ROC曲线不就是翻译敏感性与特异性之间关系